
Editorials

Select your language

e-ISSN: 2604-7322
Original article
REC Interv Cardiol. 2021;3:175-181
Tratamiento antiagregante plaquetario único o doble tras implante percutáneo de válvula aórtica. Metanálisis de ensayos clínicos aleatorizados
aDepartment of Biomedical Sciences, Humanitas University, Pieve Emanuele, Milan, Italy bCardio Center, Humanitas Clinical and Research Center - IRCCS, Rozzano, Milan, Italy cServicio de Cardiología, Hospital Universitario y Politécnico La Fe, Valencia, Spain ◊J. Sanz-Sánchez, C. A. Pivato and P. P. Leone contributed equally to this work.
Introduction and objectives: Assessment and treatment of intermediate coronary lesions, defined as those which represent 30%-90% of the vessel lumen, remains a clinical challenge. Physiological evaluation techniques, such as fractional flow reserve (FFR), non-adenosine-based methods, such as instantaneous wave-free ratio or resting full-cycle ratio, and angiography-derived physiological assessment techniques (ADPAT) have transformed the diagnostic landscape. This meta-analysis aimed to systematically review and compare the diagnostic performance of ADPAT and FFR evaluating intermediate coronary lesions.
Methods: We conducted a systematic review of comparative research on FFR and ADPAT from January through February 2024.
Results: A total of 27 studies were finally included in the meta-analysis for a total of 4818 patients and 5440 vessels. Overall, a strong correlation between the different ADPAT and FFR was observed (r = 0.83; 95%CI, 0.80-0.85), with a mean ADPAT value of 0.82; 95%CI, 0.81-0.83 and a mean FFR of 0.83; 95%CI, 0.82-0.85. The summary area under the curve for predicting significant FFR (≤ 0.80) was excellent at 0.947. The overall sensitivity rate was 85% (95%CI, 81-87) with a specificity rate of 93% (95%CI, 91-94). The positive predictive value was 86% (95%CI, 83-88) with a total negative predictive value of 92% (95%CI, 91-94).
Conclusions: ADPAT show good correlation and concordance with FFR for intermediate coronary lesion evaluation. However, due to unfavorable outcomes observed in the FAVOR III Europe trial1 with quantitative flow ratio-guided revascularization, its clinical role should be reconsidered and potentially limited to scenarios where invasive assessment or adenosine use is not feasible. Further evaluation is warranted to confirm its diagnostic performance in broader clinical contexts.
Registered at PROSPERO: CRD420251042828.
Keywords: Clinical research. Fractional flow reserve. Angiographic/fluoroscopic. Meta-analysis.
Introducción y objetivos: La evaluación y el tratamiento de las lesiones coronarias intermedias, definidas como aquellas que comprometen entre el 30 y el 90% de la luz del vaso, continúan representando un desafío clínico. Las técnicas de evaluación fisiológica (como la reserva fraccional de flujo [RFF]), los métodos que no requieren adenosina (como el índice instantáneo libre de ondas o el índice de ciclo completo en reposo) y las técnicas de evaluación fisiológica derivadas de la angiografía (ADPAT) han transformado el panorama diagnóstico. Este metanálisis tuvo como objetivo revisar sistemáticamente y comparar el rendimiento diagnóstico de las ADPAT frente a la RFF en la evaluación de lesiones coronarias intermedias.
Métodos: Entre enero y febrero de 2024 se realizó una revisión sistemática de investigaciones comparativas entre RFF y ADPAT.
Resultados: Se incluyeron 27 estudios en el metanálisis, con un total de 4.818 pacientes y 5.440 vasos. En general, se observó una fuerte correlación entre las distintas ADPAT y la RFF (r = 0,83; IC95%, 0,80-0,85), con un valor medio de ADPAT de 0,82 (IC95%, 0,81-0,83) y un valor medio de FFR de 0,83 (IC95%, 0,82-0,85). El área bajo la curva resumen para predecir una RFF significativa (≤ 0,80) fue excelente, con un valor de 0,947. La sensibilidad global fue del 85% (IC95%, 81-87) y la especificidad fue del 93% (IC95%, 91-94). El valor predictivo positivo fue del 86% (IC95%, 83-88) y el valor predictivo negativo total fue del 92% (IC95%, 91-94).
Conclusiones: Las ADPAT muestran una buena correlación y concordancia con la RFF en la evaluación de lesiones coronarias intermedias. Sin embargo, debido a los resultados desfavorables observados en el estudio FAVOR III Europe1 con la revascularización guiada por el índice cuantitativo de flujo, su papel clínico se debe reconsiderar y posiblemente limitar a escenarios en los que no sea factible realizar una evaluación invasiva ni utilizar adenosina. Se requiere una evaluación adicional para confirmar su rendimiento diagnóstico en contextos clínicos más amplios.
Registrado en PROSPERO: CRD420251042828.
Palabras clave: Investigación clínica. Reserva fraccional de flujo. Angiografía/fluoroscopia. Metanálisis.
Abbreviations
ADPAT: angiography-derived physiological assessment techniques. AUC: area under the curve. FFR: fractional flow reserve. QFR: quantitative flow ratio. uFR: ultrasonic flow ratio.
Assessment and treatment of intermediate coronary lesions (those where percent diameter stenosis accounts for 30%-90% of the vessel lumen) remains a clinical challenge.1 Over the past 10 years this field has undergone significant changes, primarily due to theoretical and technological advances in physiological evaluation techniques.2,3
Prior to the existence of these techniques, the assessment of intermediate lesions was based on the degree of relative narrowing of the vessel lumen vs healthy segments, being this reduction subjectively determined by the operator, without knowledge of its physiological repercussion.2 The development of pressure guidewire methods, along with their validation and proven prognostic significance (particularly in the context of chronic coronary syndrome) from the late 1990s to the early 2000s,4 has led to substantial progress in intermediate lesions evaluation, which has enabled a more accurate classification based on their clinical relevance.5
The initial method developed, and still considered the gold standard, is fractional flow reserve (FFR).5 This technique estimates blood flow across a coronary lesion by measuring pressure differences.6 To make this estimation between pressure and flow, maximal coronary vessel hyperemia, primarily achieved through adenosine infusion, is necessary.6 FFR is defined as significant if flow difference across the lesion is > 20% (FFR ≤ 0.80).6 Beyond merely identifying which lesions benefit from revascularization, FFR has shown improved survival vs revascularization based on relative narrowing assessment. Furthermore, it has allowed lesion exclusion where revascularization is deemed unnecessary, thus reducing stent implantation rates and any potential complications associated with both this procedure and antiplatelet therapy.7
Despite the clear benefits of using intracoronary physiology, the need for invasive pressure guidewires, IV adenosine (with its potential complications), the time required, and even the outright rejection by interventional cardiologist may have led to a lower than expected adoption.8 These limitations triggered the appearance of non-adenosine-based methods, such as quantitative flow ratio (QFR) or resting full-cycle ratio, appeared.9,10 This methods use a specific moment of the cardiac cycle (for example the QFR uses the diastolic free-wave period) where microvascular resistances are minimal, allowing correlation between pressures and flow without the use of adenosine.11,12 However, despite eliminating this limitation, the use of pressure guidewires is still a barrier.8
Simultaneously with the development of these adenosine-free techniques, angiography-derived physiological assessment techniques (ADPAT) emerged, enabling the physiological evaluation of coronary lesions without the need for a guidewire or adenosine. These techniques, initially derived from those used in coronary lesion assessment in computational tomography,13 are based on the computational evaluation of lesions through fluid dynamics in coronary angiography. Since then, multiple options have emerged including QFR, ultrasonic flow ratio (uFR), vessel fractional flow reserve (vFRR), fractional flow reserve derived from routine coronary angiography (FFRangio) and coronary angiography-derived fractional flow reserve (CaFFR). All of them have been validated and compared with the gold standard FFR in prospective direct comparative studies of diagnostic accuracy.14-20
The aim of this article was to provide a review of the different validation studies of ADPAT vs FFR and offer a meta-analysis on the accuracy of each option, both collectively and individually.
We conducted a systematic review of comparative research on FFR and ADPAT from January through February 2024. The PubMed database was used to search for articles on concordance, agreement, and diagnostic accuracy. Multiple searches were conducted using the following algorithm: FFR/FFR permuted with each mainly commercialized tool (QFR, uFR, vFRR, FFRangio and CaFFR) while trying to avoid CT and articles developed mainly in acute coronary syndrome through the commands “NOT (CT) NOT (“acute coronary syndrome”)”. Date range was limited from January 2012 through December 2023. PRISMA statement guidelines were followed, and the review was prospectively registered in the International Prospective Register of Systematic Reviews (PROSPERO) with registration No. CRD420251042828.
A total of 4580 terms were identified through the entire search process. These terms and their combinations were carefully selected by 2 different operators to refine the search for articles comparing the main ADPAT from the main commercial vs FFR. Articles involving coronary computed tomography angiography and those where comparisons were mainly drawn within the context of acute coronary syndrome were also excluded by the operators. Based on these criteria, an initial pool of studies was established.
A total of 15 studies were subsequently excluded based on prespecified criteria, including those that specified the presence of patients with concurrent or treated aortic stenosis, had more than 25% of patients diagnosed with atrial fibrillation, or involved angiography- derived physiological assessments for coronary lesions conducted within the first 29 days of acute myocardial infarction (either on the culprit lesion or non-culprit lesions).
In cases where the time elapsed from myocardial infarction to angiography-derived evaluation was nonspecific; articles were also excluded if more than 30% of patients had undergone coronary angiography due to acute myocardial infarction.
Furthermore, studies specifying the presence of 10% or more patients with prior surgical revascularization were excluded, as were those where the comparison between angiography-based physiological assessment methods and FFR was conducted on mammary artery grafts, radial artery grafts, or saphenous vein grafts.
After applying the selection criteria, a total of 29 articles were initially chosen for analysis. However, 2 articles (FAST [virtual FFR])21 and Ai et al.22 were subsequently excluded because they did not provide or calculate sensitivity and specificity data from their analyses. Consequently, the final analysis included 27 articles.
Two articles were divided and included as different items in the analysis as they showed 2 different analyzed cohorts on their studies: Smit et al.,23 where QFR was compared with the FFR in 2 cohorts: 1 with diabetes mellitus and the other without the disease; Zuo et al.24 divided patients in 2 cohorts based on whether the vessel was severely calcified or not. The uFR was compared with the FFR in each group. Each cohort was included in our analysis. Finally, the study by Emori et al.25 “Diagnostic accuracy of quantitative flow ratio for assessing myocardial ischemia in prior myocardial infarction,” presented 2 distinct cohorts based on the presence of prior myocardial infarction (≥ 30 days from coronary angiography). Although one cohort depicted an acute coronary syndrome scenario, it fulfilled our inclusion criteria, leading to the inclusion of both cohorts in the final analysis.
The homogeneity across studies was contrasted using the QH statistic. Regarding the low sensitivity of this test, P < .10 values were considered significant. To overcome this limitation, the I2 statistic was estimated as well, which measures the proportion of the total variation of the studies, explained by the heterogeneity and its 95% confidence interval (95%CI). A random effects model was used for all cases using the pooled method of DerSimonian Laird. If heterogeneity was present, meta-regression analyses were conducted to explore the sources of heterogeneity (figure 1 of the supplementary data). The presence of publication bias was tested using the Deek funnelplot (figure 2 of the supplementary data).

Figure 1. Selected articles flowchart and exclusion criteria. ADPAT, angiography-derived physiological assessment techniques; AMI, acute myocardial infarction.

Figure 2. Summary receiver operating characteristic (SROC) curves and Q* index for subgroup analyses of software-derived coronary angiography-derived fractional flow reserve (caFFR); FFR, fractional flow reserve; QFR, quantitative flow ratio; uFR, ultrasonic flow ratio; VFAI, vessel fractional anatomy index; vFFR, vessel fractional flow reserve.
From the reported values of sensitivity, specificity, negative predictive value, positive predictive value, accuracy, and the number of vessels assessed, all 2 × 2 tables for the 0.8 cutoff point of the tests were constructed. Subsequently, pooled estimates for sensitivity, specificity, positive predictive value, negative predictive value, positive likelihood ratio, and negative likelihood ratio were derived from these data.26
The confidence intervals of sensitivity and specificity were calculated using the F distribution method to compute the exact confidence limits for the binomial proportion (x/n). The summary receive operator curve (SROC) was also calculated from which we drew all the points of sensitivity and 1-specificity and adjusted the weighted regression curve using Moses’ Model. Spearman correlation coefficient between sensitivity and specificity was used to assessed constant diagnostic odds ratio (positive likelihood ratio and negative likelihood ratio) employing a symmetric SROC.27 The area under curve (AUC) was computed by numeric integration of the curve equation using the trapezoidal method. Additionally, we applied the bootstrap methods for estimated AUC of multiple SROC. We provided the resultant bootstrap P values and 95%CI of the AUC for pairwise comparisons of the different methods (table 1 of the supplementary data). Furthermore, we provided an influence diagnostic method based on the AUC by performing leave-one-study-out analyses (table 2 of the supplementary data). Pearson correlation coefficients were transformed into Fisher’s z-values to calculate variance and we performed a meta-analysis and calculated the 95%CI (figure 3 of the supplementary data). Fagan’s Nomogram (figure 4 of the supplementary data) was used to graphically estimate how the result from a diagnostic test altered the probability of a patient having a disease. We assessed applicability and risk of bias based on the modified version of the QUADAS-2 tool28 (figure 5A,B of the supplementary data). All analyses were conducted using R Statistical Software (v4.2.0; R Core Team 2022) and performed using dmetatools R package (1.1.1; Noma H 2023), mada R package (0.5.11; Sousa-Pinto 2022) and TeachingDemos R package (2.13; Greg Snow 2024).
Table 1. Patients’ baseline characteristics
| Patients’ baseline characteristics (n = 4818) | |
|---|---|
| Characteristics (cohorts where this data is available) | (± 95%CI) or % |
| Mean age (26) | 66.4 ± 1.3 |
| Male (26) | 3318 (68.9%) |
| Mean BMI (kg/m2) (17) | 26 ± 0.8 |
| Hypertension (25) | 3189 (66.2%) |
| Diabetes (25) | 1263 (26.2%) |
| Dyslipidemia (21) | 2438 (50.6%) |
| Mean LVEF (%) (10) | 59.6 ± 3.3 |
| Prior or current smoker (23) | 1406 (29.2%) |
| Prior MI (20) | 566 (11.7%) |
| Prior PCI (20) | 1314 (27.3%) |
| Prior CABG (13) | 47 (1%) |
|
BMI, body mass index; CABG, coronary artery bypass grafting; LVEF, left ventricular ejection fraction; MI, myocardial infarction; PCI, percutaneous coronary intervention. Data are expressed as mean value and standard deviation across the studies. |
|
Table 2. Indications for cardiac catheterization
| Indication for cardiac catheterization | (%) |
|---|---|
| Silent isquemia | 323 (6.8) |
| Stable angina | 2483 (51.5) |
| Acute coronary syndrome | 1475 (30.6) |
| Unstable angina | 1142 (23.7) |
| AMI | 333 (6.9) |
| NSTEMI | 204 (4.2) |
| STEMI | 13 (0.3) |
| MI subtype not specified | 116 (2.4) |
| Others | 127 (2.6) |
|
AMI, acute myocardial infarction; MI, myocardial infarction; NSTEMI, non-ST-segment elevation myocardial infarction; STEMI, ST-segment elevation myocardial infarction. |
|
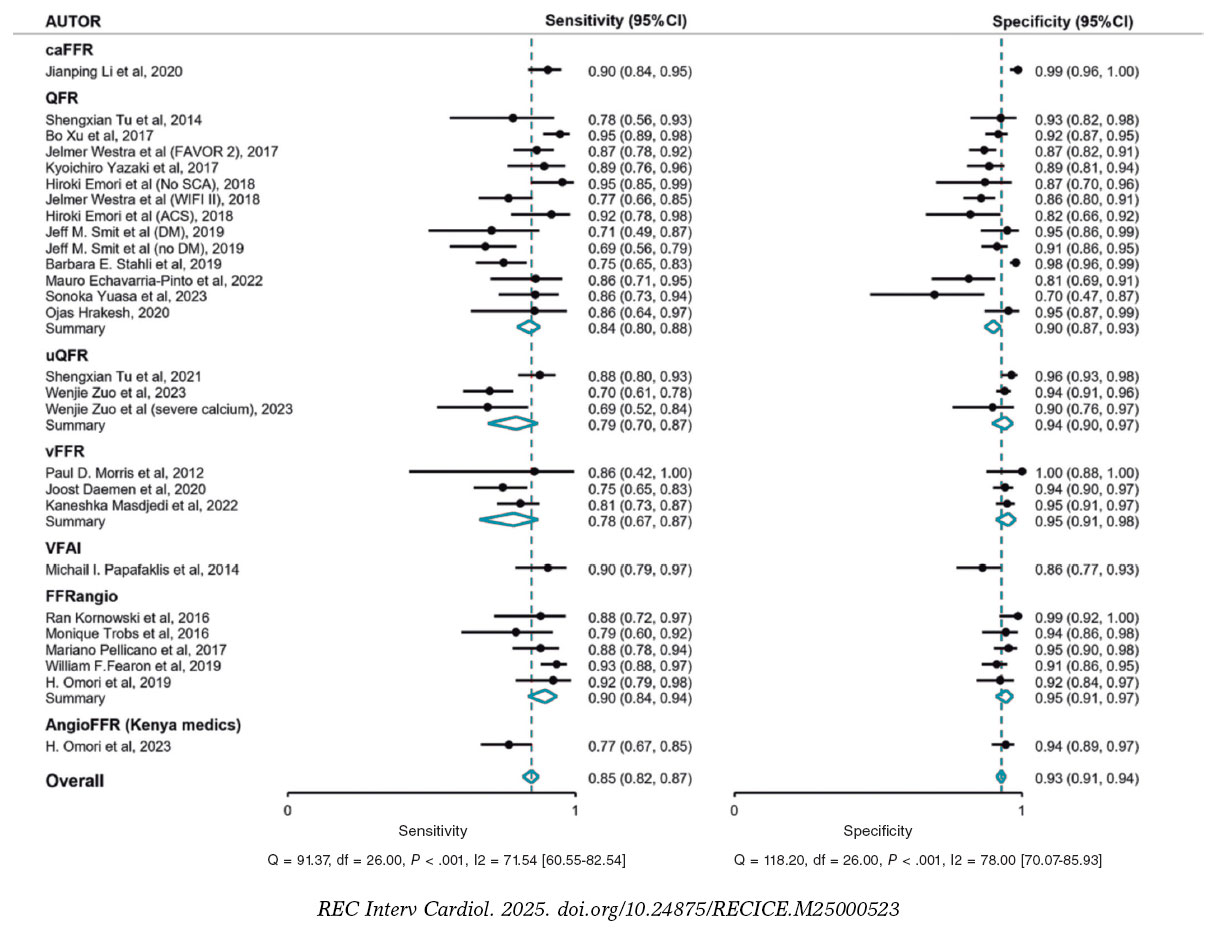
Figure 3. Forest plots and summary statistics for sensitivity and specificity estimates from a meta-analysis of FFR across different indices, using a random-effects model. 95%CI, 95% confidence interval; caFFR, coronary angiography–derived fractional flow reserve; FFR, fractional flow reserve; QFR, quantitative flow ratio; uFR, ultrasonic flow ratio; VFAI, vessel fractional anatomy index; vFFR, vessel fractional flow reserve. Xu et al.,16 2017; Fearon et al.,36 2019; Yuasa et al.,33 2023; Morris et al.,39 2013; Westra et al.,29 2018; Echavarría-Pinto et al.,31 2022; Stähli et al.,34 2019; Omori et al.,35 2019; Westra et al.,17 2018; Li et al.,18 2020; Pellicano et al.,14 2017; Emori et al.,25 2018; Tu et al.,15 2014; Zuo et al.,24 2024; Tu et al.,19 2021; Omori et al.,42 2023; Hrakesh et al.,32 2020; Kornowski et al.,37 2016; Masdjedi et al.,20 2022; Tröbs et al.,38 2016; Yazaki et al.,30 2017; Smit et al.23 2019; Daemen et al.,43 2022; and Papafaklis et al.,41 2014.

Figure 4. Forest plots and summary statistics for positive predictive value (PPV) and negative predictive value (NPV) estimates from a meta-analysis of FFR across different indices, using a random-effects model. 95%CI, 95% confidence interval; caFFR, coronary angiography–derived fractional flow reserve; FFR, fractional flow reserve; QFR, quantitative flow ratio; uFR, ultrasonic flow ratio; VFAI, vessel fractional anatomy index; vFFR, vessel fractional flow reserve. Xu et al.,16 2017; Fearon et al.,36 2019; Yuasa et al.,33 2023; Morris et al.,39 2013; Westra et al.,29 2018; Echavarría-Pinto et al.,31 2022; Stähli et al.,34 2019; Omori et al.,35 2019; Westra et al.,17 2018; Li et al.,18 2020; Pellicano et al.,14 2017; Emori et al.,25 2018; Tu et al.,15 2014; Zuo et al.,24 2024; Tu et al.,19 2021; Omori et al.,42 2023; Hrakesh et al.,32 2020; Kornowski et al.,37 2016; Masdjedi et al.,20 2022; Tröbs et al.,38 2016; Yazaki et al.,30 2017; Smit et al.,23 2019; Daemen et al.,43 2022; and Papafaklis et al.,41 2014.
Finally, a total of 27 articles were suitable for inclusion, as illustrated in figure 1. From these articles, a total of 4818 patients and 5440 vessels were added to the analysis. The population characteristics and mean cardiovascular risk factors are detailed in table 1 highlighting the existence of 3189 (66.18%) patients with hypertension, 2438 (50.6%) with dyslipidemia, and 1263 (26.2%) with diabetes. Notably, most patients included in the study were men (68.86% of the sample).
Thirteen of the selected articles were prospective in design. The most extensively studied vessel was the left anterior descending coronary artery (2921; 53.69%), followed by the right coronary artery (1075; 19.61%) and the left circumflex artery (772; 14.2%). Additionally, 89 left main coronary arteries were analyzed, accounting for 1.6% of all vessels. Angiography was primarily performed for stable angina (2483; 51.53%). Of note, while 1475 (30.61%) angiographies were prompted by acute coronary syndrome, only 333 (6.9% of the total) were performed in the context of acute myocardial infarction with or without ST-segment elevation, and the remaining 1142 in the context of unstable angina. Indications for cardiac catheterization are shown in table 2. The left anterior descending coronary artery was the most frequently studied vessel, accounting for 2921 patients (53.7% of the total studies). Proportions for other vessels are available in table 3.
Table 3. Number of studies per vessel performed across the different studies
| Vessel characteristics (n = 5440) | (%) |
|---|---|
| Left main coronary artery | 89 (1.7) |
| Left anterior descending coronary artery | 2921 (53.7) |
| Diagonal branch | 52 (1) |
| Ramus intermedius | 54 (1) |
| Left circumflex artery | 772 (14.2) |
| Obtuse marginal branch | 108 (2) |
| Right coronary artery | 1075 (19.8) |
| Posterolateral branch | 7 (0.1) |
| Interventricular branch | 8 (0.15) |
The QFR15-17,23,25,29-34 (QAngio XA 3D QFR, Medis Medical Imaging System; The Netherlands) was the most widely used software with a total of 13 patient cohorts from 11 articles, comprising 1987 patients and 2315 vessels, which accounts for 41.2% and 42.6% of the total, respectively. The correlation between QFR and FFR was excellent, showing an r = 0.82 (95%CI, 0.77-0.877). The overall sensitivity rate of QFR was 84% (95%CI, 80-88) with a specificity rate of 90% (95%CI, 87-93). The positive predictive value was 81% (95%CI, 77-84) with a total negative predictive value of 92% (95%CI, 90-94). The AUC for this technique was 0.937.
The second most analyzed technique, with a total of 5 articles, was FFRangio14,35-38 (Cathworks FFRangio, Israel), where this technology was employed in 696 patients and 841 vessels (14.4% and 15.45% of the total, respectively). The overall sensitivity rate of FFRangio was 90% (95%CI, 83-94) with a specificity rate of 95% (95%CI, 91-97). The positive predictive value was 90% (95%CI, 85-93) with a total negative predictive value of 94% (95%CI, 91-96).
vFFR (Pie Medical Imaging, The Netherlands) on the other hand, had an excellent correlation with FFR across the 3 included studies,20,39,40 contributing 647 patients and 663 vessels to the analysis (representing 13.42% of patients and 11.96% of vessels). The mean sensitivity and specificity rates were 82% (95%CI, 72-89) and 0.94% (95%CI, 89-97), respectively. The summary positive predictive value was 89% (95%CI, 82-93), and the summary negative predictive value, 91% (95%CI, 86-94).
Following its recent validation in 2022, the uFR (AngioPlus, Pulse Medical Imaging Technology, China) is supported by only 2 articles,19,24 one of which includes 2 cohorts based on vessel calcification. The uFR had a sensitivity rate of 80% (95%CI, 69-87) and a specificity rate of 0.94 (95%CI, 89-97). The summary positive predictive value was 85% (95%CI, 79-90), and the summary negative predictive value, 91% (95%CI, 87-94).
Only 1 article of CaFFR (Flashangio, Rainmed Ltd., China) was included.18
The analysis included 2 non-commercialized tools, VFAI41 and AngioFFR,42 which were not individually evaluated. Both were compared to FFR only once.
Overall, a strong correlation between the different ADPAT and FFR was observed (r = 0.83, 95%CI, 0.80-0.85), with a mean ADPAT value of 0.82 (95%CI, 0.81-0.83) (all the ADPAT set a value ≤ 0.80 for lesion significance) and a mean FFR of 0.83 (95%CI, 0.82-0.85).
The summary AUC for predicting significant FFR (≤ 0.80) was excellent at 0.947. The SROC for the different ADPAT is shown in figure 2.
The overall sensitivity rate was 85% (95%CI, 81-87) with a specificity rate of 93% (95%CI, 91-94). The positive predictive value was 86% (95%CI, 83-88) with a total negative predictive value of 92% (95%CI, 91-94). The main commercially available ADPAT values of sensibility, specificity, positive predictive value and negative predictive value are shown in figure 3 and figure 4.
Our key findings were: a) ADPAT emerge as a reliable and practical method for assessing the physiological significance of intermediate coronary lesions, which is consistent with previous literature.44-46 ADPAT consistently demonstrates agreement with the current gold standard (FFR) regarding mean values and lesion classification, without vasodilator medication or pressure guidance; b) By summarizing the diagnostic capabilities of each ADPAT from the included studies, we were able to perform the first direct comparison of various angiography-based methods for evaluating coronary lesions. We presented the main commercially available options and their respective diagnostic accuracies relative to FFR. Additionally, an overview of these techniques was provided; c) We also included innovative methods, such as uFR, based on Murray’s Law, while offering a unique approach by using a single projection to estimate lesion significance, potentially overcoming a significant limitation of current techniques, which often require specific projections and a certain quality image.
The overall results confirmed that different ADPAT serve as an appropriate method for evaluating intermediate coronary lesions, as they demonstrated a strong correlation with FFR. This correlation extended to sensitivity, specificity, and predictive values as illustrated in figure 4. Notably, the studies exhibited homogeneity without significant discrepancies in their weighting within the analysis, as observed through the resampling techniques employed.
In comparative analysis, while ADPAT exhibit adequate sensitivity and positive predictive values regarding lesion significance, their specificity and negative predictive value exceed 90%. This high specificity allows ADPAT to more accurately identify physiologically non-significant lesions, thereby avoiding unnecessary revascularization.
From a technical standpoint, it was notable that these results were primarily obtained from assessments of the left anterior descending coronary artery (53.6%), with only 1 dedicated study on the left main coronary artery. Despite this, left main coronary arteries contributed a significant proportion (1.66%) to the overall analysis, showcasing proficient classification of significant lesions (AUC = 0.82) and indicating the feasibility of applying tools in this context.
QFR was the most frequently included tool in the analysis, representing 13 out of 27 cohorts. Despite multiple validations vs the FFR in diverse contexts, most studies align closely, demonstrating a correlation between QFR and FFR.
Comparing results across different tools, minimal differences were observed, with FFRangio and CaFFR showing slightly superior overall results vs other methods. However, it’s important to note that the results of the CaFFR are based solely on validation articles, and when considering only validation studies, results among tools are very similar.
Although QFR is frequently studied, its results might require more robust validation because there are limited articles on FFRangio, especially on chronic coronary syndrome in patient groups like those with left main disease or diabetes.
While ADPAT have been validated vs the FFR in various clinical scenarios, such as severe aortic stenosis, atrial fibrillation, or non-culprit coronary lesions in acute coronary syndrome, the inclusion of these scenarios in our analysis could potentially bias the results due to variations in study characteristics and the unique features of each disease affecting lesion assessment.
The limitation of this study stems from including a large proportion of pivotal studies for each analyzed tool, which were not performed under real-world clinical conditions. Consequently, the applicability of their results may be restricted, as demonstrated by a recent study from independent laboratories comparing the 5 main non-hyperemic indices with FFR under real-life conditions.47
Although the study demonstrated a good correlation between the indices and FFR, the levels of diagnostic accuracy reported in the pivotal studies were not achieved.
In this regard, QFR has been recently evaluated vs the FFR in the FAVOR III Europe trial,1 which included 2000 patients who were randomized (1:1) to QFR-guided or FFR-guided treatment of intermediate lesions. The results showed that the QFR-guided group had higher rates of mortality, myocardial infarction, and unplanned revascularization at 12 months.
Although these findings may initially seem discouraging, they do not contradict the results of our study, in which non-hyperemic indices demonstrated superior performance over conventional angiography in the functional classification of lesions. Therefore, their use remains valuable in clinical scenarios where invasive assessment with a pressure guidewire or the use of adenosine is not feasible or contraindicated.
Of note, while QFR is currently the most widely used non-hyperemic index, it is the only one that has been evaluated in clinical trials with hard clinical endpoints vs FFR. Other tools with promising results are still to be investigated in this context.
Substantial correlations and concordances have been demonstrated between ADPAT and FFR. These techniques have also shown accurate categorization of lesions deemed significant by the current gold standard (FFR). However, the results of the FAVOR III Europe study1 indicate that QFR–guided revascularization, compared with FFR-guided revascularization, is associated with higher rates of mortality, myocardial infarction, and unplanned revascularization. Therefore, the current role of ADPAT requires re-evaluation.
In this context, the use of QFR may be most appropriate when invasive assessment using a pressure guidewire is not feasible or when adenosine is contraindicated. Additionally, due to the unique characteristics of other clinical scenarios, further reviews are warranted to evaluate the diagnostic accuracy of this index.
C. Cortés-Villar is beneficiary of a Contrato Río Hortega grant from Instituto de Salud Carlos III with code CM22/00168.
The present study was conducted in full compliance with the clinical practice guidelines set forth in the Declaration of Helsinki for clinical research and was approved by the ethics committees of the reference hospital (Hospital Clínico Universitario de Valladolid) and other participant centers. Possible sex- and gender-related biases were also taken into consideration according to the SAGER recommendations.
No artificial intelligence was used in the writing of this text.
J. Ruiz-Ruiz and C. Cortés-Villar participated in the study design, data analysis, manuscript drafting, and critical revision. C. Fernández-Cordón and M. García-Gómez contributed to data collection and results analysis. A. Lozano-Ibáñez and D. Carnicero-Martínez contributed to data gathering. S. Blasco-Turrión and M. Carrasco-Moraleja contributed to the statistical analysis. J.A. San Román-Calvar and I.J. Amat-Santos performed the final review and approved the version for publication.
None declared.

1. Andersen BK, Sejr-Hansen M, Maillard L, et al. Quantitative flow ratio versus fractional flow reserve for coronary revascularisation guidance (FAVOR III Europe):a multicentre, randomised, non-inferiority trial. Lancet. 2024;404:1835-1846.
2. Patil CV, Beyar R. Intermediate coronary artery stenosis:Evidence-based decisions in interventions to avoid the oculostenotic reflex. Int J Cardiovasc Intervent. 2000;3:195-206.
3. Gould KL, Lipscomb K, Hamilton GW. Physiologic basis for assessing critical coronary stenosis. Instantaneous flow response and regional distribution during coronary hyperemia as measures of coronary flow reserve. Am J Cardiol. 1974;33:87-94.
4. De Bruyne B, Paulus WJ, Vantrimpont PJ, Sys SU, Heyndrickx GR, Pijls NHJ. Transstenotic coronary pressure gradient measurement in humans:In vitro and in vivo evaluation of a new pressure monitoring angioplasty guide wire. J Am Coll Cardiol. 1993;22:119-126.
5. Sousa-Uva M, Neumann FJ, Ahlsson A, et al. 2018 ESC/EACTS Guidelines on myocardial revascularization. Eur J Cardio-thoracic Surg. 2019;55:4-90.
6. Tonino PAL, De Bruyne B, Pijls NHJ, et al. Fractional flow reserve versus angiography for guiding percutaneous coronary intervention. N Engl J Med. 2011;365:213-224.
7. De Bruyne B, Pijls NHJ, Kalesan B, et al. Fractional Flow Reserve–Guided PCI versus Medical Therapy in Stable Coronary Disease. N Engl J Med. 2012;367:991-1001.
8. Johnson NP, Koo BK. Coronary Psychology:Do You Believe?JACC Cardiovasc Interv. 2018;11:1492-1494.
9. De Waard GA, Di Mario C, Lerman A, Serruys PW, Van Royen N. Instantaneous wave-free ratio to guide coronary revascularisation:Physiological framework, validation and differences from fractional flow reserve. EuroIntervention. 2017;13:450-458.
10. Svanerud J, Ahn JM, Jeremias A, et al. Validation of a novel non-hyperaemic index of coronary artery stenosis severity:The Resting Full-cycle Ratio (VALIDATE RFR) study. EuroIntervention. 2018;14:806-814.
11. Davies JE, Sen S, Dehbi H-M, et al. Use of the Instantaneous Wave-free Ratio or Fractional Flow Reserve in PCI. N Engl J Med. 2017;376:1824-1834.
12. Götberg M, Christiansen EH, Gudmundsdottir IJ, et al. Instantaneous Wave-free Ratio versus Fractional Flow Reserve to Guide PCI. N Engl J Med. 2017;376:1813-1823.
13. Min JK, Leipsic J, Pencina MJ, et al. Diagnostic accuracy of fractional flow reserve from anatomic CT angiography. Jama. 2012;308:1237-1245.
14. Pellicano M, Lavi I, De Bruyne B, et al. Validation study of image-based fractional flow reserve during coronary angiography. Circ Cardiovasc Interv. 2017;10:E005259.
15. Tu S, Barbato E, Köszegi Z, et al. Fractional flow reserve calculation from 3-dimensional quantitative coronary angiography and TIMI frame count:A fast computer model to quantify the functional significance of moderately obstructed coronary arteries. JACC Cardiovasc Interv. 2014;7:768-777.
16. Xu B, Tu S, Qiao S, et al. Diagnostic Accuracy of Angiography-Based Quantitative Flow Ratio Measurements for Online Assessment of Coronary Stenosis. J Am Coll Cardiol. 2017;70:3077-3087.
17. Westra J, Andersen BK, Campo G, et al. Diagnostic performance of in-procedure angiography-derived quantitative flow reserve compared to pressure-derived fractional flow reserve:The FAVOR II Europe-Japan study. J Am Heart Assoc. 2018;7:e009603.
18. Li J, Gong Y, Wang W, et al. Accuracy of Computational Pressure-Fluid Dynamics applied to Coronary Angiography to Derive Fractional Flow Reserve –FLASH FFR. Cardiovasc Res. 2020;116:1349-1356.
19. Tu S, Ding D, Chang Y, Li C, Wijns W, Xu B. Diagnostic accuracy of quantitative flow ratio for assessment of coronary stenosis significance from a single angiographic view:A novel method based on bifurcation fractal law. Catheter Cardiovasc Interv. 2021;97(S2):1040-1047.
20. Masdjedi K, Tanaka N, Van Belle E, et al. Vessel fractional flow reserve (vFFR) for the assessment of stenosis severity:the FAST II study. EuroIntervention. 2022;17:1498-1505.
21. Masdjedi K, van Zandvoort LJC, Balbi MM, et al. Validation of a three-dimensional quantitative coronary angiography-based software to calculate fractional flow reserve:The FAST study. EuroIntervention. 2021;16:591-599.
22. Ai H, Zheng N, Li L, et al. Agreement of Angiography-Derived and Wire-Based Fractional Flow Reserves in Percutaneous Coronary Intervention. Front Cardiovasc Med. 2021;8:654392.
23. Smit JM, El Mahdiui M, van Rosendael AR, et al. Comparison of Diagnostic Performance of Quantitative Flow Ratio in Patients With Versus Without Diabetes Mellitus. Am J Cardiol. 2019;123:1722-1728.
24. Zuo W, Sun R, Xu Y, et al. Impact of calcification on Murray law-based quantitative flow ratio for physiological assessment of intermediate coronary stenoses. Cardiol J. 2024;31:205-214.
25. Emori H, Kubo T, Kameyama T, et al. Diagnostic accuracy of quantitative flow ratio for assessing myocardial ischemia in prior myocardial infarction. Circ J. 2018;82:807-814.
26. Deeks JJ. Systematic reviews of evaluations of diagnostic and screening tests. Bmj. 2001;323:157.
27. Walter SD. Properties of the summary receiver operating characteristic (SROC) curve for diagnostic test data. Stat Med. 2002;21:1237-1256.
28. Whiting PF, Reitsma JB, Leeflang MMG, et al. QUADAS-2:a revised tool for the quality assessment of diagnostic accuracy studies. Ann Intern Med. 2011;155:529-536.
29. Westra J, Tu S, Winther S, et al. Evaluation of Coronary Artery Stenosis by Quantitative Flow Ratio during Invasive Coronary Angiography:The WIFI II Study (Wire-Free Functional Imaging II). Circ Cardiovasc Imaging. 2018;11:1-8.
30. Yazaki K, Otsuka M, Kataoka S, et al. Applicability of 3-dimensional quantitative coronary angiography-derived computed fractional flow reserve for intermediate coronary stenosis. Circ J. 2017;81:988-992.
31. Echavarría-Pinto M, Van de Hoef TP, Pacheco-Beltran N, et al. Diagnostic agreement of quantitative flow ratio with fractional flow reserve in a Latin-American population. Int J Cardiovasc Imaging. 2022;38:1423-1430.
32. Hrakesh O, Hay M, Lim RY, et al. Comparison of diagnostic performance between quantitative flow ratio, non-hyperemic pressure indices and fractional flow reserve. Cardiovasc Diagn Ther. 2020;10:442-452.
33. Yuasa S, Lauri FM, Mejia-Renteria H, et al. Angiography-derived functional assessment of left main coronary stenoses. Catheter Cardiovasc Interv. 2023;101:1045-1052.
34. Stähli BE, Erbay A, Steiner J, et al. Comparison of resting distal to aortic coronary pressure with angiography-based quantitative flow ratio. Int J Cardiol. 2019;279:12-17.
35. Omori H, Witberg G, Kawase Y, et al. Angiogram based fractional flow reserve in patients with dual/triple vessel coronary artery disease. Int J Cardiol. 2019;283:17-22.
36. Fearon WF, Achenbach S, Engstrom T, et al. Accuracy of Fractional Flow Reserve Derived from Coronary Angiography. Circulation. 2019;139:477-484.
37. Kornowski R, Lavi I, Pellicano M, et al. Fractional Flow Reserve Derived From Routine Coronary Angiograms. J Am Coll Cardiol. 2016;68:2235-2237.
38. Tröbs M, Achenbach S, Röther J, et al. Comparison of Fractional Flow Reserve Based on Computational Fluid Dynamics Modeling Using Coronary Angiographic Vessel Morphology Versus Invasively Measured Fractional Flow Reserve. Am J Cardiol. 2016;117:29-35.
39. Morris PD, Ryan D, Morton AC, et al. Virtual fractional flow reserve from coronary angiography:Modeling the significance of coronary lesions. Results from the VIRTU-1 (VIRTUal fractional flow reserve from coronary angiography) study. JACC Cardiovasc Interv. 2013;6:149-157.
40. Neleman T, Masdjedi K, Van Zandvoort LJC, et al. Extended Validation of Novel 3D Quantitative Coronary Angiography-Based Software to Calculate vFFR:The FAST EXTEND Study. JACC Cardiovasc Imaging. 2021;14:504-506.
41. Papafaklis MI, Muramatsu T, Ishibashi Y, et al. Fast virtual functional assessment of intermediate coronary lesions using routine angiographic data and blood flow simulation in humans:Comparison with pressure wire - fractional flow reserve. EuroIntervention. 2014;10:574-583.
42. Omori H, Kawase Y, Mizukami T, et al. Diagnostic Accuracy of Artificial Intelligence-Based Angiography-Derived Fractional Flow Reserve Using Pressure Wire-Based Fractional Flow Reserve as a Reference. Circ J. 2023;87:783-790.
43. Scoccia A, Tomaniak M, Neleman T, Groenland FTW, Plantes ACZ des, Daemen J. Angiography-Based Fractional Flow Reserve:State of the Art. Curr Cardiol Rep. 2022;24:667-678.
44. Cortés C, Carrasco-Moraleja M, Aparisi A, et al. Quantitative flow ratio—Meta-analysis and systematic review. Catheter Cardiovasc Interv. 2021;97:807-814.
45. Faria D, Hennessey B, Shabbir A, et al. Functional coronary angiography for the assessment of the epicardial vessels and the microcirculation. EuroIntervention. 2023;19:203-221.
46. Leone AM, Campo G, Gallo F, et al. Adenosine-Free Indexes vs. Fractional Flow Reserve for Functional Assessment of Coronary Stenoses:Systematic Review and Meta-Analysis. Int J Cardiol. 2020;299:93-99.
47. Ninomiya K, Serruys PW, Kotoku N, et al. Anonymous Comparison of Various Angiography-Derived Fractional Flow Reserve Software With Pressure-Derived Physiological Assessment. JACC Cardiovasc Interv. 2023;16:1778-1790.
Introduction and objectives: Multi-fenestrated atrial septal defects (mASD) pose both diagnostic and therapeutic challenges. This study aimed to compare the outcomes of transcatheter closure in patients with mASD vs those with a single ASD at our center.
Methods: We conducted a retrospective, single-center study including adult patients who underwent transcatheter ASD closure from October 2014 through October 2024. Demographic, echocardiographic, and hemodynamic data were collected, with a the 6-month follow-up.
Results: A total of 67 patients were included, 12 of whom (18%) exhibited mASD. Patients with mASD were younger (42 vs 54 years) and more frequently presented with an interatrial septal aneurysm (91% vs 27%; P = .001). The use of multiple occlusion devices was more common in patients with mASD (34% vs 4%; P = .008). Complications were rare (5.9%) and none occurred in the mASD group. Procedural outcomes, including residual shunt and right ventricular remodeling at the follow-up, were comparable between groups.
Conclusions: Transcatheter closure of mASD is both a safe and feasible procedure, with clinical outcomes similar to those observed in patients with a single ASD.
Keywords: Ostium secundum atrial septal defects. Multi-fenestrated atrial septal defects. Transcatheter closure.
Introducción y objetivos: La comunicación interauricular (CIA) multiperforada (CIAm) supone un reto diagnóstico y terapéutico. En este estudio se comparan los resultados del cierre percutáneo en pacientes con CIAm y con CIA simple en nuestro centro.
Métodos: Estudio retrospectivo unicéntrico en pacientes adultos con CIA sometidos a cierre percutáneo entre octubre de 2014 y octubre de 2024. Se recopilaron datos demográficos, ecocardiográficos y hemodinámicos, con seguimiento a los 6 meses.
Resultados: Se incluyeron 67 pacientes, 12 de ellos con CIAm (18%). Los pacientes con CIAm eran más jóvenes (42 frente a 54 años) y presentaban con mayor frecuencia aneurisma del tabique interauricular (91 frente a 27%, p = 0,001). El uso de varios dispositivos fue más frecuente en la CIAm (34 frente a 4%, p = 0,008). Las complicaciones fueron raras (5,9%, ninguna de ellas en pacientes con CIAm). Los resultados del procedimiento (shunt residual, remodelado del ventrículo derecho) en el seguimiento fueron similares en ambos grupos.
Conclusiones: El cierre percutáneo de la CIAm es factible y seguro, con resultados similares a los observados en pacientes con CIA no multiperforada.
Palabras clave: Comunicacion interauricular ostium secundum. Comunicacion interauricular multiperforada. Cierre percutaneo.
Abbreviations
ASD: atrial septal defect. ICUS: intracoronary ultrasound. mASD: multifenestrated atrial septal defect. TEE: transesophageal echocardiography. TTE: transthoracic echocardiography.
Atrial septal defect (ASD) is the congenital heart disease most frequently diagnosed in adulthood, with the ostium secundum type being the most prevalent (80% of cases). Since the first transcatheter closures of atrial septal defects, advances in both experience and devices have made the transcatheter technique the method of choice for most patients. However, some specific cases, such as ASDs with multiple defects or multi-fenestrated ASDs (mASDs), which account for 10% of all patients with ostium secundum type ASD, continue to pose diagnostic and therapeutic challenges. Furthermore, the available scientific evidence in this subgroup is scarce.1-4
The objective of our study was to analyze and compare the results of the transcatheter closure of mASD vs the transcatheter closure of the remaining patients with ostium secundum type ASD.
We conducted a retrospective study that included all cases of transcatheter ASD closure performed in adults older than 18 years at our center from October 2014 through October 2024.
The patients’ demographic, echocardiographic, and hemodynamic data were collected, including a 6-month follow-up following the intervention, assessing residual shunt and echocardiographic parameters such as right ventricular remodeling. This is a retrospective study in which the patients’ informed consent was obtained for the use of their interventional procedure for research purposes. The authors confirm that the interventions were performed in full compliance with the regulations of the Clinical and Ethical Research Committee and the Declaration of Helsinki of the World Medical Association.
The primary endpoint of this study is to analyze the clinical and echocardiographic results of the transcatheter closure of mASDs. Similarly, these results are compared with those obtained after the transcatheter closure of simple (non-multi-fenestrated) ostium secundum type ASDs.
Qualitative variables are expressed as percentages and the continuous ones as mean and standard deviation, or as median with interquartile range, depending on whether they follow a normal distribution. For inter-group comparison, the chi-square test or Fisher’s exact test was used for qualitative variables, and the Student’s t-test or the Mann-Whitney U test for continuous variables, as appropriate. The threshold for statistical significance was set at P < .05. Analyses were performed with SPSS software (version 21; IBM Corp, Armonk, NY, United States).
During the study period, a total of 67 transcatheter closures of ostium secundum type ASDs were performed in patients older than 18 years. The patients’ baseline characteristics and ASDs, the procedure, and the results are shown in table 1. The mean age of the population was 52 years, with a predominance of women (65%). The most common indication for ASD closure was dilation of the right ventricular dilatation (88%). In most cases (91%), transcatheter closure was performed with a single device; however, due to anatomical complexity, 5 patients required 2 devices and 1, 3 devices. The combination of transthoracic echocardiography (TTE) and fluoroscopy was the advanced imaging modality selected to guide the procedure in 65% of cases. Four out of all patients had perioperative complications. Three of these complications were due to device embolization, and all recovered uneventfully; 1 patient presented paroxysmal atrial flutter that required pharmacological cardioversion with amiodarone. All patients progressed favorably and were discharged at 24 hours without complications. At follow-up, 82% had no residual shunt, and zero cases of grade ≥ II shunt were found.
Table 1. Baseline characteristics of all patients undergoing transcatheter atrial septal defect closure
| Variable | Total (n = 67) |
|---|---|
| Age | 52 ± 14 years |
| Sex, female | 44 (65%) |
| ASD size | 14 ± 6 mm |
| Atrial septal aneurysm | 26 (38%) |
| Closure indication: RV dilatation | 59 (88%) |
| Perioperative imaging | |
| TEE + fluoroscopy | 44 (66%) |
| ICUS + fluoroscopy | 11 (16%) |
| TEE + ICUS + fluoroscopy | 12 (18%) |
| Number of implanted devices | |
| 1 | 61 (91%) |
| 2 | 5 (7.5%) |
| 3 | 1 (1.5%) |
| Device size | 20 ± 7 mm |
| Perioperative complications | 4 (5.9%) |
| Grade 0 shunt at 6 months | 55 (82%) |
| Residual shunt grade ≥ 2 at 6 months | 0 (0%) |
| Preoperative PASP | 32 ± 9 mmHg |
| Postoperative PASP | 27 ± 7 mmHg |
| RV (baseline EDD) | 44 ± 7 mm |
| RV (follow-up EDD) | 38 ± 6 mm |
|
ASD, atrial septal defect; EDD, end-diastolic diameter; ICUS, intracoronary ultrasound; PASP, pulmonary artery systolic pressure; RV, right ventricle; TEE, transesophageal echocardiography. |
|
Twelve out of all the patients with ASD closure (18%) had ≥ 2 atrial septal defects, whose characteristics are shown in table 2. The patients’ mean age was 42 years, with an equitable sex distribution. Right heart dilatation was the most common reason for closure (83%), with 2 patients presenting with strokes. All patients were in New York Heart Association functional class I-II/IV.
Table 2. Baseline characteristics, procedure, and outcomes of patients undergoing transcatheter closure of multi-fenestrated atrial septal defects
| Patient | Total | 1 | 2 | 3 | 4 | 5 | 6 | 7 | 8 | 9 | 10 | 11 | 12 |
|---|---|---|---|---|---|---|---|---|---|---|---|---|---|
| Age (years) | 52 | 33 | 27 | 39 | 60 | 41 | 30 | 50 | 36 | 32 | 50 | 61 | |
| Sex | Male | Female | Female | Female | Male | Female | Male | Male | Male | Female | Male | Female | |
| No. of defects | 2 | 2 | 2 | 3 | 2 | 2 | 3 | 3 | 4 | 2 | 2 | 2 | |
| Largest defect size | 8.5 mm | 4 mm | 10 mm | 2 mm | 10 mm | 12 mm | 6 mm | 14 mm | 3 mm | 10 mm | 14 mm | 6 mm | |
| Location | AS | AS | AS | AS | AS | AS | Central | AS | PI | AS | AS | AS | |
| IDD | 19 mm | 13 mm | 7 mm | 12 mm | 10 mm | 6 mm | 18 mm | 17 mm | < 1 mm | 8 mm | 10 mm | 16 mm | |
| Aneurysm | Yes | Yes | No | Yes | Yes | Yes | Yes | Yes | Yes | Yes | Yes | Yes | |
| Closure indication | Dilated RV | Stroke | Dilated RV | Stroke | Dilated RV | Dilated RV | Dilated RV | Dilated RV | Dilated RV | Dilated RV | Dilated RV | Dilated RV | |
| TEE/ICUS | TEE + ICUS | TEE + ICUS | TEE | TEE | TEE | TEE + ICUS | TEE | TEE | TEE | TEE | TEE | TEE | |
| N. of devices | 2 | 2 | 2 | 1 | 1 | 1 | 1 | 2 | 1 | 1 | 1 | 1 | |
| Device type | Amplatzer SO (AGA Medical, United States) | Amplatzer SO, Amplatzer Cribriform (AGA Medical, United States) | Figulla Flex (FFO, Occlutech GmbH, Germany) | Amplatzer Cribriform (AGA Medical, United States) | Amplatzer Cribriform (AGA Medical, United States) | Amplatzer SO (AGA Medical, United States) | Amplatzer Cribriform (AGA Medical, United States) | Amplatzer SO (x2) (AGA Medical, United States) | Amplatzer Cribriform (AGA Medical, United States) | Amplatzer SO (AGA Medical, United States) | Occlutech (Occlutech Int. AB, Sweden) | Amplatzer Cribriform (AGA Medical, United States) | |
| Device size | 10, 14 mm | 8, 18 mm | 7.5, 12 mm | 35 mm | 30 mm | 16 mm | 40 mm | 18, 8 mm | 25 mm | 14 mm | 16 mm | 35 mm | |
| Residual shunt at 24 h (grade) | 1 | 0 | 1 | 0 | 0 | 1 | 0 | 0 | 0 | 0 | 1 | 0 | |
| Residual shunt at 6 months (grade) | 0 | 0 | 1 | 0 | 0 | 1 | 0 | 0 | 0 | 0 | 1 | 0 | |
| Complications | No | No | No | No | No | No | No | No | No | No | No | No | |
| Preoperative PASP | 24 mmHg | 32 mmHg | 28 mmHg | – | 24 mmHg | 28 mmHg | 28 mmHg | 29 mmHg | 22 mmHg | 24 mmHg | 15 mmHg | 15 mmHg | 33 mmHg |
| PASP at 6 months | 23 mmHg | 25 mmHg | 26 mmHg | – | 22 mmHg | 25 mmHg | 23 mmHg | 25 mmHg | 28 mmHg | 23 mmHg | 12 mmHg | 12 mmHg | 29 mmHg |
| Baseline RV (EDD) | 42 mm | 49 mm | 28 mm | 36 mm | 30 mm | 51 mm | 38 mm | 45 mm | 51 mm | 50 mm | 43 mm | 49 mm | 42 mm |
| RV (EDD) at 6 months | 37 mm | 43 mm | 27 mm | 28 mm | 29 mm | 42 mm | 34 mm | 42 mm | 42 mm | 41 mm | 39 mm | 42 mm | 41 mm |
|
AS, anterosuperior; EDD, end-diastolic diameter; ICUS, intracoronary ultrasound; IDD, interdefect distance; PASP, pulmonary artery systolic pressure; |
|||||||||||||
Regarding the echocardiographic study of mASDs, all patients underwent a TEE prior to the procedure. Patients had between 2 (66% of cases) and 4 atrial septal defects. The most common location of the largest defect was anterosuperior (10 patients), and most (92%) had an associated atrial septal aneurysm (defined as a displacement > 10 mm). The sizes of the largest defects and the distance between the defects are shown in table 2. No patient had pulmonary hypertension prior to the procedure.
Regarding the procedure, all cases were guided by transesophageal echocardiography (TEE) and fluoroscopy, and 3 of them by intracoronary ultrasound (ICUS). In most cases, a single closure device was used (66% of patients); however, in 4 cases, 2 devices were needed, which were implanted during the same procedure (simultaneous implantation). The most widely used devices were the Amplatzer Septal Occluder (AGA Medical, United States) and the Amplatzer Cribriform (AGA Medical, United States). In one procedure, the Figulla Flex device (FFO, Occlutech GmbH, Germany) was used, and in another, the Occlutech device (Occlutech International AB, Sweden). Figure 1 shows one of the procedures that required 2 devices and was fluoroscopy-, TEE-, and ICUS-guided.

Figure 1. A: fluoroscopic image of the closure of a multi-fenestrated atrial septal defect with 2 devices guided by fluoroscopy, transesophageal echocardiography, and intracoronary ultrasound. B: transesophageal echocardiography, mid-esophageal plane, showing the 2 implanted closure devices.
Transcatheter closure was successful in all patients with mASD, without intraoperative complications. Transthoracic echocardiography (TTE) was performed 24 hours after closure and, then, 6 months later. Acetylsalicylic acid monotherapy was prescribed at discharge and maintained for 3 months, except for the 2 patients who had a stroke.
At 6 months, 75% showed no residual shunt, while the remaining 25% showed a grade 1 shunt (minimal, without hemodynamic consequences). Most patients with right ventricular dilatation, (8 out of 9 patients) showed a reduction in the baseline right ventricular end-diastolic diameter after the procedure. There were no strokes at the follow-up.
Table 3 compares the characteristics and results of transcatheter closure in patients with a single ASD and with mASD. In our cohort, patients with mASD were significantly younger (42 vs 54 years; P = .011), with no statistically significant differences in sex distribution (50% vs 69%; P = .207). The mASD group had smaller defects (8 mm vs 16 mm in the single ASD group) and a higher prevalence of atrial septal aneurysm (91% vs 27%). In both groups, the most frequent indication for closure was right heart dilatation. No differences were observed in the choice of imaging modality during the procedure or in the mean size of the implanted device. However, patients with mASD more frequently required > 1 device (single device in 66% vs 96% in the single ASD group). There were no inter-group differences regarding complications or the presence of residual shunt during follow-up.
Table 3. Comparison of patients with transcatheter closure of single vs multi-fenestrated atrial septal defect
| Variable | Single ASD (n = 55) | Multifenestrated ASD (n = 12) | P |
|---|---|---|---|
| Age | 54 ± 14 years | 42 ± 11 years | .011 |
| Female sex | 38 (69%) | 6 (50%) | .207 |
| ASD size | 16 ± 6 mm | 8 ± 4 mm | .001 |
| Septal aneurysm | 15 (27%) | 11 (91%) | .001 |
| Closure indication: RV dilatation | 49 (89%) | 10 (83%) | .577 |
| Perioperative imaging: TEE + fluoroscopy | 35 (63%) | 9 (75%) | .223 |
| No. of implanted devices | 53 (96%) | 8 (66%) | .008 |
| Device size | 19 ± 7 mm | 22 ± 8 mm | .283 |
| Perioperative complications | 4 (7%) | 0 (0%) | .335 |
| Residual shunt grade 0 at 6 months | 48 (87%) | 9 (75%) | .280 |
|
ASD, atrial septal defect; RV, right ventricle; TEE, transesophageal echocardiography. |
|||
Transcatheter closure of ostium secundum ASD has become a safe and effective alternative in adult patients. Our study analyzed the results of transcatheter ASD closure in patients older than 18 years, highlighting the differences between single ASD and mASD.
At our center, transcatheter closure has proven to be safe and effective in patients with mASD. The results obtained indicate a high success rate associated with the procedure, with the absence of significant intraoperative complications and a good short- and mid-term safety profile.
A relevant finding is that patients with mASD were significantly younger than those with a single ASD, which could be explained by the earlier detection of these defects due to more evident symptoms, or by the presence of atrial septal aneurysm, which in our cohort was significantly more frequent in the mASD group. This data is consistent with the literature, which describes a strong association between atrial septal aneurysm and the presence of multiple defects.5
As expected, the use of multiple devices was more common in the mASD group than in the single ASD group. Although most cases were treated with a single device in patients with mASD, a considerable percentage (40%) required additional devices due to greater anatomical complexity. This finding highlights the importance of a thorough preoperative planning and the need to guide the intervention with TEE or ICUS. Although the TEE provides a wider field of view, the ICUS is particularly useful in certain situations, as it allows for a more precise visualization of the posteroinferior border of the atrial septum.6
The described complications associated with transcatheter ASD closure include arrhythmias, atrioventricular block, and device erosion. Device embolization is usually a consequence of inadequate size or incorrect placement, and its incidence rate is < 1%. In our cohort of patients, complications were a rare finding, with only 3 cases of device embolization and 1 of supraventricular arrhythmia being reported. In the literature, there are doubts on whether these complications are more common when implanting multiple devices; however, in our patients with mASD, 40% of whom needed > 1 device, no complications were observed.7
Most patients with mASD showed complete closure of the defect at 6 months (75%), and the remaining 25% had a minimal shunt without hemodynamic consequences. A high percentage of patients with right heart dilatation showed favorable right ventricular remodeling. Furthermore, the absence of strokes during the observation period indicates the effectiveness of the procedure in terms of secondary prevention in this subgroup of patients.
Among the limitations of our study, the following stand out: first, those inherent to its observational and retrospective design, in addition to being single-centered. Furthermore, the number of patients with mASD is relatively small (n = 12), which reduces statistical power. The absence of a control group of patients with mASD treated conservatively or with surgical closure prevents direct comparisons on the relative benefits of each strategy. Prospective studies with a larger sample size and prolonged follow-up will be necessary to confirm our findings and optimize the management of these patients.
Although the transcatheter closure of mASD is a solid therapeutic option in selected patients, with results comparable to those observed in patients with a single ASD, the need for prospective and multicenter studies remains to confirm these findings and optimize the therapeutic strategy in this group of patients.
None declared.
Informed consent was obtained from all patients for the use of their interventional procedure for research purposes. The authors confirm that procedures were performed in full compliance of the regulations of the Clinical and Ethical Research Committee, and of the Helsinki Declaration of the World Medical Association. The authors confirm that sex and gender variables have been taken into consideration according to the SAGER guidelines.
Artificial intelligence has not been used for the development of this work.
L. Cerdán Ferreira and M. López Ramón contributed to data collection. L. Cerdán Ferreira performed the statistical analysis. G. Fuertes Ferre, J. Sánchez-Rubio Lezcano, and M. López Ramón contributed to result interpretation. L. Cerdán Ferreira and G. Fuertes Ferre wrote the article, which was later reviewed by G. Fuertes Ferre, J. Sánchez-Rubio Lezcano, and M. López Ramón.
None declared.
1. Brida M, Chessa M, Celermajer D, et al. Atrial septal defect in adulthood:a new paradigm for congenital heart disease. Eur Heart J. 2022;43:2660-2671.
2. Masseli J, Bertog S, Stanczak L, et al. Transcatheter closure of multiple interatrial communications. Catheter Cardiovasc Interv. 2013;81:825-836.
3. Yang Y, Xu Z, Jiang S, et al. Simultaneous Transcatheter Closure of Multiple Atrial Septal Defects Using Dual Amplatzer Septal Occluder Devices. Am J Med Sci. 2016;352:245-251.
4. Butera G, Romagnoli E, Saliba Z, et al. Percutaneous closure of multiple defects of the atrial septum:procedural results and long-term follow-up. Catheter Cardiovasc Interv. 2010;76:121-128.
5. Silvestry FE, Cohen MS, Armsby LB, et al. Guidelines for the Echocardiographic Assessment of Atrial Septal Defect and Patent Foramen Ovale:From the American Society of Echocardiography and Society for Cardiac Angiography and Interventions. J Am Soc Echocardiogr. 2015;28:910-958.
6. Fuertes-Ferre G, Hernández Hernández F, López Ramón M, Sánchez Rubio J, Sánchez Insa E, Galache Osuna JG. Transcatheter closure of a complex atrial septal defect after occluder device embolization. Cardiovasc Revasc Med. 2017;18:34-37.
7. Bradley EA, Zaidi AN. Atrial Septal Defect. Cardiol Clin. 2020;38:317-324.
Introduction and objectives: Although early discharge protocols after transcatheter aortic valve implantation (TAVI) have demonstrated to be safe in various studies, they are usually applied in high-experience centers. This study analyzes the length of stay of the first 100 patients undergoing TAVI in a center without on-site cardiac surgery, differentiating between very early (< 24 hours), early (24-48 hours), and late discharge (> 48 hours). Furthermore, the study evaluates the feasibility of an early discharge protocol during the team’s learning curve.
Methods: We conducted a prospective observational study from April 2022 through January 2024. A preand postoperative management protocol was implemented, including assessments in the Valvular Heart Disease Clinic, admission to the cardiac surgery intensive care unit with electrocardiographic monitoring, and specific discharge criteria in full compliance with an established protocol for the management of conduction disorders. Early follow-up evaluations were performed in the outpatiently after discharge.
Results: A total of 100 patients (50% women) were included, with a mean age of 82.4 ± 5.3 years and a EuroSCORE II score of 4.38 ± 5.1%. The median length of stay was 2 days (range, 1-19). A total of 27.27% of patients were discharged in < 24 hours, 48.49% within the 24-48 hours following implantation, and 24.24% 48 hours later. The 30-day cardiovascular mortality rate was 1%. A total of 6 patients were readmitted with procedural complications within the first 30 days.
Conclusions: The implementation of a standardized care protocol allows for early and safe discharge in most patients, even during the team’s learning cuve.
Keywords: TAVI. Transcatheter aortic valve implantation. Length of stay. Early discharge. Learning curve.
Introducción y objetivos: Los protocolos de alta precoz tras el implante percutáneo de válvula aórtica (TAVI) han demostrado ser seguros en diversos estudios, aunque solo se aplican en centros con amplia experiencia. Este estudio analiza la duración de la estancia hospitalaria de los primeros 100 pacientes receptores de TAVI en un centro sin cirugía cardiaca in situ, diferenciando entre alta muy temprana (< 24 horas), temprana (24-48 horas) y tardía (> 48 horas), y evalúa la viabilidad de un protocolo de alta temprana durante la fase de aprendizaje del equipo.
Métodos: Estudio observacional prospectivo realizado entre abril de 2022 y enero de 2024. Se implementó un protocolo de cuidados prey posprocedimiento, que incluye valoración en la consulta de patología valvular, ingreso en la unidad de cuidados agudos cardiológicos con monitorización electrocardiográfica y criterios específicos para el alta según un protocolo establecido para el tratamiento de los trastornos de la conducción. Se realizó una evaluación precoz en la consulta tras el alta.
Resultados: Se incluyó a 100 pacientes (el 50% mujeres), con una edad media de 82,4 ± 5,3 años y EuroSCORE II de 4,38 ± 5,1%. La mediana de estancia hospitalaria fue de 2 días (rango: 1-19). Se dio de alta al 27,27% de los pacientes en < 24 horas, al 48,49% en las 24-48 horas posteriores al implante y al 24,24% después de 48 horas. La mortalidad de causa cardiovascular a 30 días fue del 1%. En los primeros 30 días, 6 pacientes reingresaron por motivos relacionados con el procedimiento.
Conclusiones: La aplicación de un protocolo de cuidados estandarizado permite un alta temprana y segura en la mayoría de los pacientes, incluso durante la fase de aprendizaje del equipo.
Palabras clave: TAVI. Implante percutáneo de válvula aórtica. Estancia hospitalaria. Alta temprana. Curva de aprendizaje.
Abbreviations
CLBBB: complete left bundle branch block. CRBBB: complete right bundle branch block. TAVI: transcatheter aortic valve implantation.
In our setting, transcatheter aortic valve implantation (TAVI) has become the treatment of choice for patients older than 75 years or with high surgical risk.1 Despite the good results documented in various studies, the stay after the procedure remains considerably long. According to data from the Spanish registry2, the mean length of stay is approximately 8 days. Given the increasing volume of patients, it is essential to implement protocols that optimize the length of stay and facilitate early discharge.
Experiences documented to this date on early discharge protocols after TAVI have demonstrated their safety profile.3-13 However, there is no uniform definition of the term “early discharge,” as it can range from 24 to 72 hours after the procedure.3-13
Most studies share common characteristics. On the one hand, they focus on procedures with a minimalist approach that favors faster patient recovery.14,15 On the other hand, many of them exclusively include patients with favorable pre-implant conditions,3-5,10,12 such as absence of frailty, adequate femoral access for transcatheter closure, absence of advanced conduction disorders, low-risk aortic annulus anatomy, body mass index < 35, left ventricular ejection fraction > 30%, and adequate family support. Consequently, these protocols only cover 22-55% of patients treated with TAVI.
A study conducted by a Spanish group has shown that early discharge, combined with artificial intelligence-based follow-up, is a safe strategy comparable to prolonged hospitalization in an unselected population after TAVI.13
Another important aspect is the type of valves used in the studies. Although the safety profile of early discharge after balloon-expandable valve implantation has been demonstrated,6,7 evidence on self-expanding valves is scarcer, due to doubts about the occurrence of conduction disturbances in the following days. However, in recent years, experiences have been published indicating that early discharge after the implantation of this type of valve is also safe.4,5,8,13,14
Finally, another relevant issue in these studies is that they have been conducted in highly experienced centers.3-13 Several analyses show that centers with a higher volume of procedures and more accumulated experience have lower complication rates and better overall results,16,17 which may translate into greater confidence in adopting early discharge practices.
It seems clear that reducing the length of stay through the implementation of early discharge protocols is a strategy that has demonstrated its feasibility in experienced centers. However, its application in those starting TAVI programs requires additional studies that ensure comparable results in terms of safety. Therefore, the objective of our study is to evaluate the length of stay of the first 100 patients treated with TAVI in our hospital (very early discharge: < 24 hours; early discharge: 24-48 hours; late discharge: > 48 hours) and determine the feasibility of establishing an early discharge protocol during the team’s learning curve.
We conducted a prospective, single-center registry that consecutively included all patients with severe symptomatic aortic stenosis who underwent TAVI in a center without on-site cardiac surgery, from the beginning of the program. The reference cardiac surgery department is located in a different center 2 km away.
The patients’ baseline characteristics, pre- and postoperative electrocardiographic and echocardiographic findings, the procedural characteristics, and the 30-day and 1-year clinical outcomes were recorded. The registry has been approved by Hospital Universitario Nuestra Señora de Candelaria ethics committee. Relevant informed consents were obtained.
We developed a pre- and postoperative care protocol to standardize patient management (figure 1), in such a way that during the week prior to implantation, a cardiologist and a nurse specialized in TAVI jointly assess patients in the monographic valvular heart disease clinic. During this visit, additional tests are reviewed, the patient and their family are briefed on the procedure and possible complications, the informed consent form and a leaflet with relevant information are provided (drug management, how to proceed on implantation day, contact telephone number, etc.). Patients receive a call from nursing staff 48 hours prior to the intervention to remind them of the instructions.

Figure 1. Pre- and postoperative care protocol for transcatheter aortic valve implantation. ECG, electrocardiogram.
On the morning of the procedure, patients go to the interventional cardiology unit of our center, where a venous line is established, an electrocardiogram is performed, and prophylactic antibiotics are administered. After implantation, they are admitted to the acute cardiac care unit with electrocardiographic monitoring. The next day, the absence of complications is ruled out, an electrocardiogram and a transthoracic echocardiogram are performed, and the discharge decision is made according to the protocol for the approach and treatment of conduction disorders by Rodés-Cabau J et al.18 adapted to our center (figure 2).
During follow-up, a telephone consultation is conducted 48 hours after discharge to rule out any complications, and a face-to-face consultation with electrocardiogram and transthoracic echocardiogram is performed 10 days later. If progress is adequate, follow-up continues in general cardiology clinics. The care protocol and the algorithm for the treatment of conduction disorders are showin in figure 1 and figure 2, respectively.

Figure 2. Protocol for the management of conduction disorders after transcatheter aortic valve implantation. Very early discharge: < 24 hours; early discharge: 24-48 hours. AVB, atrioventricular block; ECG, electrocardiogram; EPS, electrophysiological study; LBBB: left bundle branch block; RBBB, right bundle branch block.
During the team’s learning curve, a “mixed” approach was selected. Procedures were performed under general anesthesia. Regarding vascular access, transcatheter transfemoral primary access and closure with double Prostyle (Abbott Vascular, United States) and AngioSeal (Terumo) were prioritized; the radial route was used as secondary access. Pacing was performed with a balloon-tipped electrocatheter via jugular venous access. Urinary catheterization was omitted. The self-expanding Evolut R/PRO+ (Medtronic, United States and Ireland) and ACURATE neo2 (Boston Scientific, United States) valve were implanted. Transthoracic echocardiography was used for postoperative monitoring.
The endpoint of this study is to analyze the length of stay of the first 100 patients undergoing TAVI in our center, differentiating between very early (< 24 hours), early (24-48 hours), and late discharge (> 48 hours) and evaluate the possibility of establishing an early discharge protocol during the team’s learning curve.
In addition, we aim to evaluate clinical outcomes according to the VARC-3 standardized definitions,19 including cardiovascular and non-cardiovascular mortality at 30 days and between 30 days and 1 year, procedural or cardiovascular-related rehospitalizations at 30 days, need for pacemaker implantation in the same period, and rate of neurological events, bleeding complications > BARC 3a, major vascular complications, and cardiac structural complications.
Qualitative variables are expressed as absolute frequency and percentage, and the continuous ones as mean and standard deviation.
The first 100 patients treated with TAVI in a tertiary referral center without an on-site cardiac surgery department were prospectively included from April 2022 through January 2024.
The patients’ baseline characteristics are shown in table 1. Of note, 50% were men, with a mean age of 82.4 ± 5.3 years. The STS score was 4.3 ± 5.1% and the EuroSCORE II score, 4.38 ± 5.1%. The main indication for implantation was age older than 75 years in 96% and high surgical risk in patients younger than 75 years in 4%. Regarding baseline conduction disorders, 10% of patients had complete left bundle branch block, 11%, complete right bundle branch block, and 12% a previously implanted pacemaker.
Table 1. Patient characteristics and indication for transcatheter aortic valve implantation
| Variables | Values |
|---|---|
| Baseline characteristics | |
| Age, years | 82.4 ± 5.36 |
| Sex (male/female) | 50/50 |
| Cardiovascular risk factors | |
| Hypertension | 73 (73) |
| Diabetes mellitus | 43 (43) |
| Dyslipidemia | 61 (61) |
| Active smoking | 16 (16) |
| Past medical history | |
| Coronary artery disease | 37 (37) |
| Previous cardiac surgery | 13 (13) |
| Atrial fibrillation | 34 (34) |
| Heart failure | 31 (31) |
| Chronic kidney disease | 44 (44) |
| Previous permanent pacemaker | 12 (12) |
| Previous LBBB | 10 (10) |
| Previous RBBB | 11 (11) |
| Baseline echocardiogram | |
| LVEF, % | 58.8 ± 10.1 |
| Peak gradient, mmHg | 71.4 ± 15.8 |
| Mean gradient, mmHg | 44.8 ± 10.8 |
| Aortic valve area, cm2 | 0.75 ± 0.139 |
| Aortic regurgitation | 36 (36) |
| Bicuspid aortic valve | 3 (3) |
| Surgical risk | |
| EuroSCORE II | 4.32 ± 5.15 |
| STS score | 4.38 ± 3.34 |
| Indication for implantation | |
| Age > 75 years | 96 (96) |
| High surgical risk in patients < 75 years | 4 (4) |
|
LBBB, left bundle branch block; LVEF, left ventricular ejection fraction; RBBB, right bundle branch block; STS, Society of Thoracic Surgeons. Unless otherwise indicated, data are expressed as frequency and percentage (n, %) or mean ± standard deviation. |
|
Procedural characteristics and perioperative results are summarized in table 2. Procedures were performed under general anesthesia, and all patients were extubated in the operating room. Access was transcatheter transfemoral in 95% of patients, with closure using double Prostyle (Abbott Vascular, United States) and AngioSeal (Terumo, Japan). A total of 5% of these patients required surgical access by the vascular surgery service (2%, femoral; 3%, axillary). Second access was radial in 98% of cases.
Table 2. Procedural characteristics and perioperative outcomes
| Procedural characteristics and outcomes | Values |
|---|---|
| Characteristics | |
| Proctored (yes/no) | 24/76 |
| Vascular access | |
| Transcatheter femoral | 95 (95) |
| Surgical femoral | 2 (2) |
| Surgical axillary | 3 (3) |
| Native valve | 98 (98) |
| Valve-in-valve | 2 (2) |
| Predilation | 88 (88) |
| Postdilation | 22 (22) |
| Type of valve | |
| Evolut R/PRO+, Medtronic | 87 (87) |
| ACURATE neo2, Boston Scientific | 13 (13) |
| Perioperative outcomes | |
| Intraoperative mortality | 0 (0) |
| Post-implantation gradient > 20 mmHg | 0 (0) |
| Aortic regurgitation > grade II | 2 (2) |
| Aortic annulus rupture | 0 (0) |
| Aortic dissection | 0 (0) |
| Coronary artery occlusion | 0 (0) |
| Device embolization | 0 (0) |
| Conversion to surgery | 0 (0) |
|
Data are expressed as frequency and percentage (n, %). |
|
A total of 24 proctored cases were performed. Valve implantation was successful in 100% of cases. A total of 98 procedures were performed on native aortic valves (95, trileaflet; 3, bicuspid) and 2 on degenerated surgical bioprostheses using the chimney stent technique. Self-expanding valves were implanted (87%, Evolut R/PRO+; 13%, ACURATE neo2).
The immediate outcome was monitored with transthoracic echocardiography. More than moderate residual aortic regurgitation occurred in only 2 patients. There were no annular ruptures, aortic complications, coronary artery occlusions, device embolizations, or need for conversion to surgery. No patients died during the procedure.
Mortality and complications after TAVI are shown in table 3. The 30-day cardiovascular mortality rate was 1% (1 patient who died during hospitalization due to heart failure complicated by a respiratory sepsis). In the follow-up after discharge, 2 deaths due to non-cardiovascular causes were recorded: 1 patient died from aspiration pneumonia at 6 months and another due to complications derived from colon cancer 9 months after implantation.
Table 3. Complications and mortality after transcatheter aortic valve implantation
| Complications and Mortality | n (%) |
|---|---|
| Transient LBBB | 26 (33) |
| Persistent LBBB at discharge | 6 (7.6) |
| Pacemaker implantation at 30 days | 11 (12.5) |
| Stroke | 1 (1) |
| Bleeding complications > BARC 3a | 1 (1) |
| Major vascular complications | 4 (4) |
| Cardiovascular rehospitalization at 30 days | 6 (6) |
| Cardiovascular mortality at 30 days | 1 (1) |
| Non-cardiovascular mortality at 30 days | 0 (0) |
| Cardiovascular mortality from 30 days to 1 year | 0 (0) |
| Non-cardiovascular mortality from 30 days to 1 year | 2 (2) |
|
BARC: Bleeding Academy Research Consortium scale; LBBB: left bundle branch block. a Data are expressed in numbers and percentages (n, %). |
|
Within the first 30 days, 6 patients required admission for procedural or cardiovascular-related causes. The reason for admission was infection in 3 patients: a wound infection in a patient who underwent surgical femoral access, an early infective endocarditis that had a good outcome with optimal medical therapy, and a pacemaker pocket infection that required device explantation and contralateral implantation. One patient was admitted with heart failure for developing rapid atrial fibrillation. Two patients were admitted for syncope; one had a PR interval of 350 ms and the other complete atrioventricular block. Both underwent permanent pacemaker implantation.
The rate of major vascular complications was 4%: 3 patients presented stenosis or dissection of the common femoral artery requiring stent implantation during the same procedure; furthermore, a femoral pseudoaneurysm was detected in 1 patient and was surgically repaired. One case of BARC > 3a bleeding complication was detected; the patient required transfusion of 2 packed red blood cell concentrates due to lower GI bleeding.
One patient had a stroke at 24 hours. The need for permanent pacemaker implantation was 12.5% within the first 30 days. The delay for permanent pacemaker implantation once the indication was established was < 48 hours.
The pre-specified care protocol was implemented in all patients (figure 1 and figure 2). As a result, the median length of stay was 2 days (range, 1-19) for all patients (table 4). Regarding time to discharge (figure 3), 27 patients (27.27%) were discharged within the first 24 hours (very early discharge), 48 (48.49%) between 24 and 48 hours after implantation (early discharge), while 24 patients (24.24%) had to be hospitalized for more than 48 hours (late discharge). Late discharges corresponded to 8 patients whose TAVI was performed during admission for heart failure or cardiogenic shock, 10 patients who had pre-existing conduction disorders (mainly first-degree atrioventricular block or complete right bundle branch block) or who developed them after implantation and required prolonged electrocardiographic monitoring, 2 patients who underwent surgical femoral access, 2 patients with major vascular complications, 1 patient who had a stroke at 24 hours, and 1 patient who developed bacteremia due to Streptococcus mitis.

Figure 3. Length of stay of the first 100 TAVI patients. TAVI, transcatheter aortic valve implantation.
Table 4. Length of stay
| Length of stay | Time |
|---|---|
| Length of stay, days | 2 (1-19) |
| Very early discharge < 24 hours | 27 (27.27) |
| Early discharge 24-48 hours | 48 (48.49) |
| Late discharge > 48 hours | 24 (24.24) |
|
ME: median; n: number. Data are expressed in days and median (interquartile range) or in number and percentage (n, %). |
|
The main findings of our study are a) it is feasible to establish a protocol that favors the early discharge of patients during the medical team’s learning curve; b) approximately 75% of patients achieve early discharge (< 48 hours); and c) it is a safe strategy associated with a low rate of adverse events at 30 days.
The progressive increase in the number of patients we will be facing in the coming years makes it essential to establish protocols that optimize the length of stay and allow for efficient use of resources.
Several experiences can be found in the literature confirming that early discharge protocols after TAVI are safe. The main problems they present are the lack of a standardized definition of early discharge, which can vary from 24 to 72 hours,3-13 and that most studies on early discharge agree on including patients with favorable anatomical characteristics,3-5,10,12 such as adequate femoral access for transcatheter closure, absence of advanced conduction disorders, low-risk aortic annulus anatomy, body mass index < 35, and left ventricular ejection fraction > 30%; in addition, they exclude patients with factors that could prolong the length of stay, such as frailty or lack of family support. Following these criteria, only 59% of our patients would have been eligible for an early discharge program, yet we were able to discharge 75% of the patients within the first 48 hours. In our series, the median length of stay for outpatients with the favorable characteristics described above is 2 days (1-10), and that of outpatients who did not meet favorable criteria is 2 days (1-18), while the length of stay of the 8 patients undergoing TAVI during hospitalization for decompensated heart failure or cardiogenic shock is 10.5 days (1-30). In this regard, the experience of Herrero et al.13 is noteworthy, who demonstrated in their study that most patients (73%) in an unselected population can be safely discharged within the first 24-48 hours.
The minimalist approach14,15 is another key aspect that has been shown to favor early discharge. This approach is especially suitable when conducted by experienced teams and applied to collaborative, hemodynamically stable patients without anatomical characteristics involving a higher risk of complications. Its implementation should be progressive, so that the safety profile of the procedure is guaranteed as the fundamental priority. We opted to start the TAVI program with a “mixed” approach with general anesthesia, mainly femoral or radial access, pacing with a transvenous pacemaker, and monitoring with transthoracic echocardiography until the team overcame the learning curve. All patients were successfully extubated in the operating room. Therefore, we believe that this type of approach did not cause any delays in patient discharge. Once the first 100 cases have been completed, we are transitioning towards a fully minimalist procedure due to the benefits this entails for the patient.
The safety profile of early discharge after the implantation of self-expanding valves has been widely discussed4,5,8,13,14, due to the increased risk of developing cardiac conduction disorders. In our study, all patients received a self-expanding valve. The algorithm by Rodés-Cabau et al.18 was applied to determine the duration of electrocardiographic monitoring and manage conduction disorders. The need for permanent pacemaker implantation was confirmed in 12.5% of cases within the first 30 days. Only 2 patients required readmission after discharge due to advanced conduction disorders requiring pacemaker implantation.
In addition, it is important to have a close follow-up system that allows for the early detection of post-discharge complications and ensures continuity of care. To this end, our patients receive a telephone consultation 48 hours after discharge, and a face-to-face consultation with electrocardiograms and echocardiograms being performed at 10 days. They also have a telephone number to contact the team during working hours. Undoubtedly, this is a system that takes human and economic resources. Experiences have been reported in which the implementation of a virtual voice assistant facilitates the detection of complications, thus demonstrating the effectiveness of this system,13 which should be considered the standard we should look for in clinical practice.
Reducing the length of stay after TAVI requires a real commitment from the heart team to the implementation and adherence to an early discharge protocol. The BENCHMARK study20 showed that adherence to an 8-point structured protocol allows for shorter lengths of stay of approximately 2 days. The key aspects identified in this protocol include educating the health care team, a clear definition of discharge criteria, a structured decision algorithm to assess the need for pacemaker implantation, echocardiographic or angiographic follow-up of the puncture site, early patient mobilization, patient and family education, and anticipated discharge planning from admission. In our own experience, the role of a cardiologist coordinating the TAVI program, along with close collaboration with key units and services, such as acute cardiac care, imaging, electrophysiology, anesthesiology, vascular surgery, and radiology, has enabled the effective implementation of these strategies. This approach has facilitated the consolidation of an early discharge protocol from the start of the program.
Our study has multiple limitations that may affect result extrapolation. On the one hand, this was a study of observational design conducted in a single center and with a small sample size; additionally, a total of 24 cases were performed under supervision. On the other hand, only self-expanding valves were used, meaning that results cannot be generalized to other types of valves.
During the team’s learning curve, the application of a standardized care protocol allows for early and safe discharge after TAVI in most patients in an unselected population.
None declared.
Approval was obtained from Hospital Universitario Nuestra Señora de Candelaria ethics committee. Informed consents are available. The SAGER guidelines regarding potential sex and gender biases have been followed.
Artificial intelligence has not been used for the development of the study.
R. Pimienta González and A. Quijada Fumero participated developing the protocol, collecting data, and drafting the manuscript. All authors participated in the study design, critically reviewed the text, and approved its final version.
None declared.
1. Vahanian A, Beyersdorf F, Praz F, et al.;ESC Scientific Document Group. 2021 ESC/EACTS guidelines for the management of valvular heart disease. Eur Heart J. 2022;43:561-632.
2. Jimenez-Quevedo P, Munoz-Garcia A, Trillo-Nouche R, et al. Time trend in transcatheter aortic valve implantation:an analysis of the Spanish TAVI registry. REC Interv Cardiol. 2020;2:98-105.
3. Wood DA, Lauck SB, Cairns JA, et al. The Vancouver 3M (Multidisciplinary, Multimodality, But Minimalist) Clinical Pathway facilitates safe next-day discharge home at low-, medium-, and high-volume transfemoral transcatheter aortic valve replacement centers:the 3M TAVR study. JACC Cardiovasc Interv. 2019;12:459-469.
4. Asmarats L, Millán X, Cubero-Gallego H, et al. Implementing a fast-track TAVI pathway in times of COVID-19:necessity or opportunity?REC Interv Cardiol. 2022;4:150-152.
5. García Carreño J, Zatarain E, Tamargo M, et al. Feasibility and safety of early discharge after transcatheter aortic valve implantation. Rev Esp Cardiol. 2023;76:655-663.
6. Barbanti M, Van Mourik M, Spence M, et al. Optimising patient discharge management after transfemoral aortic valve implantation:the multicentre European FAST-TAVI trial. EuroIntervention. 2019;15:147-154.
7. Kamioka N, Wells J, Keegan P, et al. Predictors and clinical outcomes of next-day discharge after minimalist transfemoral transcatheter aortic valve replacement. JACC Cardiovasc Interv. 2018;11:107-115.
8. Moriyama N, Vento A, Laine M, et al. Safety of next-day discharge after transfemoral transcatheter aortic valve replacement with a self-expandable versus balloon-expandable valve prosthesis. Circ Cardiovasc Interv. 2019;12:1-9.
9. Baekke PS, Jørgensen TH, Søndergaard L. Impact of early hospital discharge on clinical outcomes after transcatheter aortic valve implantation. Catheter Cardiovasc Interv. 2021;98:E282-E290.
10. Krishnaswamy A, Isogai T, Agrawal A, et al. Feasibility and safety of same-day discharge following transfemoral transcatheter aortic valve replacement. JACC Cardiovasc Interv. 2022;15:575-589.
11. Hanna G, Macdonald D, Bittira B, et al. The safety of early discharge following transcatheter aortic valve implantation among patients in Northern Ontario and rural areas utilizing the Vancouver 3M TAVR study clinical pathway. CJC Open. 2022;4:1053-1059.
12. Barker M, Sathananthan J, Perdoncin E, et al. Same-day discharge post-transcatheter aortic valve replacement during the COVID-19 pandemic:the multicenter PROTECT TAVR study. JACC Cardiovasc Interv. 2022;15:590-598.
13. Herrero Brocal M, Samper R, Riquelme J, et al. Early discharge programme after transcatheter aortic valve implantation based on close follow-up supported by telemonitoring using artificial intelligence:the TeleTAVI study. Eur Heart J Digit Health. 2024;6:73-81.
14. Lauck SB, Wood DA, Baumbusch J, et al. Vancouver transcatheter aortic valve replacement clinical pathway:minimalist approach, standardized care, and discharge criteria to reduce length of stay. Circ Cardiovasc Qual Outcomes. 2016;9:312-321.
15. Pinar Bermúdez E. Debate:Minimalist approach to TAVI as a default strategy. REC Interv Cardiol. 2021;3:304-306.
16. Vemulapalli S, Carroll JD, Mack MJ, et al. Procedural volume and outcomes for transcatheter aortic-valve replacement. N Engl J Med. 2019;380:2541-2550.
17. Núñez-Gil IJ, Elola J, García-Márquez M, et al. Percutaneous and surgical aortic valve replacement. Impact of volume and type of center on results. REC Interv Cardiol. 2021;3:103-111.
18. Rodes-Cabau J, Ellenbogen KA, Krahn AD, et al. Management of conduction disturbances associated with transcatheter aortic valve replacement:JACC Scientific Expert Panel. J Am Coll Cardiol. 2019;74:1086-1106.
19. Généreux P, Piazza N, Alu MC, et al. Valve Academic Research Consortium 3:Updated Endpoint Definitions for Aortic Valve Clinical Research. J Am Coll Cardiol. 2021;77:2717-2746.
20. Frank D, Durand E, Lauck S, et al. A streamlined pathway for transcatheter aortic valve implantation:the BENCHMARK study. Eur Heart J. 2024;45:1904-1916.
Introduction and objectives: Several tools have been implemented to assess the functional significance of coronary lesions. Their reliability in the management of acute coronary syndrome (ACS) might be affected by alterations in the acute phase that go beyond the affected area. Our main objective was to evaluate the reliability of invasive physiological indices for non-culprit lesions (NCL) in patients with ACS.
Methods: We conducted a systematic review across ClinicalTrials.gov, Embase, Google Scholar, PubMed, and Web of Science from inception through 5 December 2024. Additionally, a citation analysis and web searches were conducted.
Results: A total of 20 articles, with 4379 patients were included in the analysis. The main study design is a cohort study. The following methods were compared between acute and staged interventions: a) angiography-derived; b) hyperemic; and c) non-hyperemic indices. A significant difference in fractional flow reserve, instantaneous wave-free ratio, and quantitative flow ratio was found in one or more articles. There were no articles reporting any important changes in the Murray law-based quantitative flow ratio, resting distal-to-aortic coronary pressure ratio, or vessel fractional flow reserve. However, these indices rely on retrospective and/or limited data. All significant variations were observed in cohorts of ST-segment elevation myocardial infarction. Unlike quantitative flow ratio, the fractional flow reserve and instantaneous wave-free ratio demonstrated consistent directions of change towards lower and higher values, respectively. Prospective cohorts and randomized controlled trials including non-ST-segment elevation acute coronary syndrome did not prove the existence of significant differences between acute and follow-up fractional flow reserve.
Conclusions: Physiological methods lack complete reliability for evaluating NCL during acute ST-segment elevation myocardial infarction. However, considering directions of change, fractional flow reserve is suitable for guiding the revascularization of acute positive NCL. Conversely, instantaneous wave-free ratio can be used to defer the revascularization of negative NCL. In non-ST-segment elevation acute coronary syndrome, fractional flow reserve is appropriate for assessing NCL within the acute phase.
Keywords: Fractional flow reserve. Instantaneous wave-free ratio. Quantitative flow ratio.
Introducción y objetivos: Se han implementado varias herramientas para evaluar la importancia funcional de las lesiones coronarias. Su fiabilidad en el síndrome coronario agudo (SCA) podría verse afectada por perturbaciones en la fase aguda que se extienden más allá de la zona afectada. Nuestro objetivo principal fue evaluar la fiabilidad de los índices fisiológicos invasivos para las lesiones no culpables (LNC) en pacientes con SCA.
Métodos: Se realizó una revisión sistemática en ClinicalTrials.gov, Embase, Google Scholar, PubMed y Web of Science, desde el inicio hasta el 06/12/2024. Además, se hizo un análisis de citas y búsquedas en la web.
Resultados: Se incluyeron en el análisis 20 estudios, que abarcaban 4.379 pacientes. El principal diseño de estudio es el de cohorte. Se compararon los siguientes métodos entre procedimientos agudos y diferidos: a) índices derivados de la angiografía; b) índices hiperémicos; y c) índices no hiperémicos. En uno o más artículos se hallaron diferencias significativas en la reserva fraccional de flujo, el índice diastólico instantáneo sin ondas y el cociente de flujo cuantitativo. Ningún artículo informó de cambios importantes en el cociente de flujo cuantitativo basado en la ley de Murray, el cociente de presión coronaria distal-aórtica en reposo o la reserva fraccional de flujo del vaso. Sin embargo, estos estudios se basan en datos retrospectivos o limitados. Todas las variaciones significativas se observaron en cohortes de pacientes con infarto de miocardio con elevación del segmento ST. A diferencia del cociente de flujo cuantitativo, la reserva fraccional de flujo y el índice diastólico instantáneo sin ondas mostraron direcciones de cambio coherentes, hacia valores más bajos y más altos, respectivamente. Las cohortes prospectivas y los ensayos controlados aleatorizados que incluyeron pacientes con infarto de miocardio sin elevación del segmento ST no encontraron diferencias importantes entre la reserva fraccional de flujo aguda y la diferida.
Conclusiones: Los métodos fisiológicos no tienen una total fiabilidad para evaluar la gravedad de las LNC durante el infarto agudo de miocardio con elevación del segmento ST. Sin embargo, teniendo en cuenta las direcciones del cambio, la reserva fraccional de flujo es adecuada para guiar la revascularización de una LNC positiva en la fase aguda. Por el contrario, el índice diastólico instantáneo sin ondas se puede utilizar para aplazar la revascularización de una LNC con valoración negativa. En el SCA sin elevación del segmento ST, la reserva fraccional de flujo es adecuada para evaluar una LNC en la fase aguda.
Palabras clave: Reserva fraccional de flujo. Indice diastolico instantaneo sin ondas. Cociente de flujo cuantitativo.
Abbreviations
ACS: acute coronary syndrome. FFR: fractional flow reserve. iFR: instantaneous wave-free ratio. NCL: non-culprit lesions. QFR: quantitative flow ratio.
The optimal strategy and timing of complete revascularization in patients with ST-segment elevation myocardial infarction (STEMI) and multivessel coronary artery disease remains unclear, and current recommendations are controversial.1 According to 2023 European Society of Cardiology (ESC) guidelines, complete revascularization, based solely on angiographic severity, is recommended in “stable” STEMI patients.2 Conversely, the 2023 Asia-Pacific Expert Consensus Document suggested a treatment strategy of non-culprit lesions (NCL) based on angiographic severity and invasive physiological assessment with fractional flow reserve (FFR) or non-hyperemic pressure ratios for patients with STEMI.3
FFR and non-hyperemic pressure ratios may be inaccurate in acute coronary syndrome (ACS), as hyperemic flow may be reduced due to microcirculatory dysfunction, while the resting flow may be higher due to neurohumoral compensatory mechanisms.4
Angiography-derived indices are additional physiological tools. They need ≥ 1 angiographic projections plus frame count analysis and/or aortic pressure that may also be different in the acute setting.
Furthermore, drugs such as hypolipidemic agents may promote plaque regression, potentially impacting the results of physiological assessment after a few months into therapy.5
Our main objective was to evaluate the changes in invasive physiological measurements of NCL between the acute and staged phases of ACS.
Secondly, we aimed to evaluate the effects of different therapies on physiological measurements.
We included studies that evaluated the physiology of NCL during acute and staged interventions for ACS. Studies conducted on assessments following percutaneous coronary interventions of non-culprit vessels, or with patients with chronic coronary syndrome were excluded.
Case reports, conference abstracts, commentaries, editorials, and reviews were excluded as well. An initial protocol was registered in PROSPERO with registration No. CRD42024574683.
We conducted the search across ClinicalTrials.gov, Embase (via Ovid), Google Scholar, PubMed, and Web of Science from inception through 26 April 2024 (initial search). We used the “Review articles” filter in Google Scholar and the “Topic” field in Web of Science. No language restrictions were applied.
Duplicates were removed using Deduplicator (SR-Accelerator) software. Title/abstract and full text screening was conducted independently by 2 authors using Rayyan software.
Back in July, 2 authors conducted a backward and forward citation analysis of the included articles using Citationchaser software.
The search strings were repeated in 6 December 2024 (in Embase, sources with invalid date limits were excluded). Simultaneously, we looked into any online conference news on imaging modalities and physiological measurements.6 Additionally, we looked into the “Slide Library” section using the “2024” filter on another web page.7
Finally, we manually reviewed the references of the articles included after the initial search.
All discrepancies were resolved by consensus.
Selection process was recorded in sufficient detail to complete a Preferred Reporting Items for Systematic reviews and Meta-Analyses (PRISMA) flow diagram.8
The following data were extracted from each article: a) study characteristics; b) population characteristics; c) type of physiological index(es); d) follow-up duration; e) primary endpoint.
The primary endpoint was the variation between acute and staged indices regarding statistical significance, mean difference (MD), and disagreement on revascularization decision.
One author extracted the data, and another one checked it independently. We contacted the authors of eligible studies when clarifications were needed.
Risk of bias was assessed using the Joanna Briggs Institute (JBI) critical appraisal tools,9-11 as appropriate.
Two authors independently assessed the risk of bias for each study. We used red for high, yellow for moderate, and green for low risk of bias based on positive answers being ≤ 49%, 50%-69%, or ≥ 70%.
We conducted a descriptive synthesis of the evidence. Results from data extraction were shown in separate tables based on risk of bias, or bubble charts. Some data were rounded to the nearest integer (age, diameter of stenosis of NCL, and follow-up) or 2 decimal places (MD).
Unless otherwise specified, P values < .05 were considered statistically significant. When MDs were unreported, they were estimated by calculating the difference between staged and acute mean values. When required, a formula for estimating the means was applied.12
In bubble charts, the size of the bubbles represents the number of patients or lesions if the former was not reported. Acute−/staged+ disagreement indicates an acute value above the threshold, with the staged value below the revascularization cut-off. Acute+/staged− disagreement represents the opposite.
Results of the search and selection processes are shown in figure 1. Extracted data are shown in table 1 and table 2.

Figure 1. PRISMA flow diagram. PRISMA, preferred reporting items for systematic reviews and meta-analyses.
Table 1. Extracted data of studies with low risk of bias
| First author | Patients (No.) | Age (years) | STEMI (%) | PDS of NCL (%) | Type of index | Follow-up (days) | Comparison across measurements | |
|---|---|---|---|---|---|---|---|---|
| P-value | Mean difference (staged−acute value) | |||||||
| Bär13 | 94a | 59 ± 10 | 53 | 37 ± 8 | cQFR | 365 | NR | 0.00 |
| 99b | 58 ± 8 | 54 | 37 ± 8 | NR | − 0.01 | |||
| Cortés14 | 88 | 68 ± 11 | 100 | 59 ± 12 | cQFR | 6 ± 4 | S | + 0.06 |
| Erbay15 | 321 | 66 [58-76] | 50.5c | 47 [36-57] | cQFR | 49 [42-58] | NS | + 0.01 |
| Hou16 | 2256 | 64 ± 6 | 100 | 65 ± 9 | muQFR | (7-45) | NS | 0.00 |
| Huang17 | 92 | 65 ± 10 | 100 | (30-80) | vFFR | 15 [3-30] | NS | 0.00 |
| Kirigaya18 | 50 | 63 ± 11 | 100 | 46 ± 13 | cQFR | 14 ± 5 | NS | + 0.01 |
| Mensink19 | 150d | 64 ± 9 | 35.3 | NR | FFR | 84 | NR | 0.00 |
| Musto20 | 50 | 68 ± 11 | 100 | 58 ± 12 | FFR | 6 ± 2 | NS | 0.00 |
| iFR | NS | 0.00 | ||||||
| Ntalianis21 | 101 | 63 ± 12 | 74.2 | 56 ± 14 | FFR | 35 ± 4 | NS | 0.00 |
| Sejr-hansen22 | NRe | NR | 100 | 56 [48-66] | cQFR | 13 [7-31] | NS | − 0.02 |
| iFR | S | + 0.02 | ||||||
| Shukla23 | 31 | 56 ± 8 | 100 | 78 ± 9 | FFR | 18 ± 4 | S | − 0.01 |
| Thim24 | 120 | 66 ± 11 | 100 | 50 [41-59] | iFR | 16 [5-32] | S | + 0.03 |
| Van der Hoeven25 | 73 | 61 ± 10 | 100 | 55 ± 13 | FFR | 31 ± 6 | S | − 0.03 |
| iFR | NS | + 0.01 | ||||||
| Resting Pd/Pa | NS | + 0.01 | ||||||
| Wang26 | 70 | 62 | 100 | NR | QFR | 30 | NS | − 0.01 |
| FFR | S | − 0.03 | ||||||
| Zhao27 | 102f | 66 ± 6 | 100 | 64 ± 5 | cQFR | 365 | NR | + 0.01 |
| 253g | 65 ± 6 | 64 ± 6 | NR | − 0.01 | ||||
|
cQFR, contrast quantitative flow ratio; FFR, fractional flow reserve; iFR, instantaneous wave-free ratio; muQFR, Murray law-based QFR; NCL, non-culprit lesions; NR, not reported; NS, non-significant; Pd/Pa, distal-to-aortic coronary pressure ratio; QFR, quantitative flow ratio; PDS, percent diameter stenosis; S, significant; STEMI, ST-segment elevation myocardial infarction; vFFR, vessel fractional flow reserve. Data are expressed as mean, mean ± standard deviation or median [interquartile range] or (range) (age, PDS of NCL, follow-up). a Statin + alirocumab subgroup. b Statin + placebo subgroup. c Percentage of ST-segment elevation acute coronary syndrome. d Overall population (statin + evolocumab or placebo subgroups). e No. of lesions analyzed: 70. f Statin + evolocumab subgroup. g Statin monotherapy subgroup. |
||||||||
A total of 20 articles were included13-32 (1 article in the form of a conference presentation).19 Publication years went from 2010 through 2024. The total number of reported patients was 4379.
In every publication, the patients are predominantly men and non-diabetic. The main clinical presentation was STEMI, except for 3 studies.19,29,31
The following methods were assessed: a) angiography-derived: Murray law-based quantitative flow ratio (muQFR), quantitative flow ratio (QFR), vessel FFR (vFFR); b) hyperemic (FFR); and c) non-hyperemic indices: instantaneous wave-free ratio (iFR), resting distal-to-aortic coronary pressure ratio (Pd/Pa). When reported, the FFR was obtained using adenosine.
Reported patients for each index are as follows: 2340 (muQFR), 1187 (QFR), 710 (FFR), 243 (iFR), 92 (vFFR), and 73 (resting Pd/Pa).
The studies mainly used an observational (cohort) design. Cohort studies on angiography-derived methods were retrospective, except for 1 article on QFR.28 Those on FFR and non-hyperemic indices were prospective, except for 2 substudies.22,26
QFR was also evaluated by 1 quasi-experimental study27 and 1 randomized controlled trial.13
Finally, the FFR was assessed by 2 randomized controlled trials, in samples with predominance of non-ST-segment elevation myocardial infarction (NSTEMI).19,31,33
Results are shown in table 1 of the supplementary data, table 2 of the supplementary data, and table 3 of the supplementary data. There were no studies with high risk of bias.
Table 2. Data drawn from studies with moderate risk of bias
| First author | Patients (No.) | Age (years) | STEMI (%) | PDS of NCL (%) | Type of index | Follow-up (days) | Comparison across measurements | |
|---|---|---|---|---|---|---|---|---|
| P-value | Mean difference (staged−acute value) | |||||||
| Barauskas28 | 79 | NR | 100 | (35-75) | QFR | ≥ 91 | NSa | − 0.02 |
| Jo29 | 115 | 60 ± 12 | 32.2 | NR | FFR | 182 | NS | − 0.01 |
| Li30 | 84 | 60 ± 11 | 100 | (50-90) | muQFR | 8 ± 2 | NS | 0.00 |
| Park31 | 60b | 57 ± 11 | 30 | NR | FFR | 182 | NS | − 0.02 |
| 60c | 59 ± 10 | 33.3 | NR | NS | − 0.01 | |||
| Spitaleri32 | 31 | 64 ± 12 | 100 | 59 ± 13 | cQFR | (3-4) | NS | 0.00 |
|
cQFR, contrast quantitative flow ratio; FFR, fractional flow reserve; muQFR, Murray law-based QFR; NCL, non-culprit lesions; NS, non-significant; NR, not reported; PDS, percent diameter stenosis; QFR, quantitative flow ratio; STEMI, ST-segment elevation myocardial infarction. Data are expressed as ≥ lower limit or mean or mean ± standard deviation or (range) (age, PDS of NCL, follow-up). a Level of significance was set at P < .001. b Ticagrelor subgroup. c Clopidogrel subgroup. |
||||||||
There were no articles on relevant changes in muQFR,16,30 resting Pd/Pa,25 and vFFR17 at the follow-up.
A significant difference in FFR, iFR, and QFR was found in 3, 2, and 1 article(s),14,22-26 respectively. In 1 study, the difference in QFR was non-significant, with a significance threshold of .001.28
These variations were seen in cohorts of STEMI patients.14,22-26 Studies including non-ST-segment elevation acute coronary syndrome (NSTEACS) did not show any relevant differences regarding the QFR15 or the FFR.19,21,29,31
A total of 4 articles20,22,25,26 evaluated > 1 method. The iFR and FFR were both stable in the study by Musto et al.,20 while the iFR was more stable than the FFR in a different article.25 The QFR was compared to both the FFR26 and the iFR.22 Unlike these indices, the QFR did not show any significant changes in staged phases.22,26
The most valued indices showed varying results. muQFR had MD values close to 0 in both studies.16,30
QFR variations were observed at both lower22,26,28 and higher values.14,15,18 Conversely, the FFR and the iFR varied towards smaller and greater values, respectively.22-26,29,31 Their MDs ranged from − 0.02 to + 0.06 (QFR), − 0.03 to 0.00 (FFR), and 0.00 to + 0.03 (iFR).14,19-21,24,25,28 MD values of 0.01 were observed more often.
In STEMI patients, the MDs of the FFR, the iFR, and the QFR were close to 0 only in studies with mean follow-ups of < 1 week.20,32 In studies including NSTEACS, the FFR MDs were close to 0 after longer mean follow-ups (> 1 month).19,21 Furthermore, Ntalianis et al. showed a greater stability of FFR in patients with NSTEMI (MD, 0.00) vs those with STEMI (MD, − 0.02).21
Disagreement in the indication for revascularization is shown in figure 2. MDs of 0.01 resulted in variable disagreements: 5%-18%.15,18,23,25

Figure 2. Disagreement between acute and staged values in the indication for PCI. B, Barauskas; C, Cortés; E, Erbay; FFR, fractional flow reserve; H, Huang; iFR, instantaneous wave-free ratio; K, Kirigaya; L, Li; muQFR, Murray law-based QFR; N, Ntalianis; PCI, percutaneous coronary intervention; QFR, quantitative flow ratio; SE, Sejr-Hansen; SH, Shukla; SP, Spitaleri; T, Thim; V, van der Hoeven; vFFR, vessel fractional flow reserve.
Unlike the QFR, the FFR and the iFR consistently showed a higher frequency of one type of disagreement: acute−/staged+ for FFR,21,23,25 and acute+/staged− for iFR.24,25
A total of 4 studies compared the effects of different drugs on the physiological parameters.13,19,27,31
Ticagrelor (which can increase the levels of adenosine) was compared to clopidogrel and no significant differences were found in the FFR of non-culprit vessels after 6 months of treatment.31
Another 3 studies compared a proprotein convertase subtilisin/kexin type 9 (PCSK9) inhibitor (eg, alirocumab or evolocumab) plus high-intensity statin (HIST) (eg, rosuvastatin 20 mg/day) vs statin-only therapy.13,19,27
In a nonrandomized study, the QFR values were significantly higher in the evolucumab group at 12 months.27 However, in 2 randomized studies, no significant differences were observed across the 2 treatment groups in the QFR at 12 months or in the FFR at 3 months, respectively.13,19
The main findings of this systematic review are these: firstly, in STEMI patients, the muQFR, resting Pd/Pa, and vFFR indices remained relatively stable in retrospective and/or small studies. The FFR, iFR, and QFR showed variability between acute and staged phases. Secondly, the FFR did not change significantly in prospective cohorts or randomized controlled trials including NSTEACS. Thirdly, the QFR was more stable than both the FFR and the iFR in direct comparisons, although only the FFR and the iFR exhibited consistent directions of change. Fourthly, PCSK9 inhibitors added to HIST did not influence physiological measurements compared with HIST in randomized controlled trials.
The muQFR demonstrated stability in a large sample of patients. This index is based on a single angiographic view, unlike other angiography-based methods that require 2 angiographic projections. This characteristic might reduce observer variability and enhance reliability. Future prospective and comparative studies are needed to confirm the validity of this method.
Although low variations for FFR, iFR, and QFR were observed in cohorts of STEMI patients,20,32 these studies were limited by short-term follow-ups. Thim et al. found a non-significant change in the iFR with 5-day follow-ups, whereas there were significant changes with ≥ 5 day follow-ups.24 Therefore, physiological disarrangements initiated at the acute moment of STEMI might still exist if a staged procedure is conducted close to the index event.24,25
Angiographic, hemodynamic, and microcirculatory variables may alter acute physiologic assessment and account for the higher reliability of the FFR in NSTEACS vs STEMI.
In patients with microvascular dysfunction, epicardial blood flow cannot increase sufficiently during maximal hyperemia, thus causing a reduced pressure gradient across the stenotic lesion,29 and higher FFR values.
In STEMI patients, microcirculatory indices (coronary flow reserve and index of microcirculatory resistance) were significantly worse during the acute phase, along with a higher FFR.25 Conversely, studies including NSTEACS did not show any significant differences in the coronary flow reserve and/or index of microcirculatory resistance at the follow-up.21,29,31
Furthermore, STEMI patients showed greater acute angiographic severity, along with lower QFR or iFR values,14,22 which may be attributed to vasoconstriction typically occurring during the acute phase.
Consequently, the FFR seems more reliable in NSTEACS vs STEMI due to reduced acute microcirculatory impairment and/or vasoconstriction.
Literature trials support the use of the FFR in NCL of NSTEMI during the acute phase (eg, within the index hospitalization).34,35 In contrast, acute FFR-guided complete revascularization did not show any significant benefits in terms of death or myocardial infarction in STEMI patients.36-39
The higher stability of QFR when directly compared to the FFR or the iFR was limited to a small number of patients in post-hoc substudies.22,26 A MD of 0.01 sometimes led to non-trivial disagreement on revascularization decision,25 likely due to baseline values being near the cut-off. Therefore, it is essential to have an index which remains stable or demonstrates consistent changes, such as the FFR and the iFR. Similarly, these indices demonstrated a greater frequency of a specific type of disagreement (methodological variations–wire positioning–may explain the less frequent cases of disagreement).24
Therefore, the FFR and the iFR could be considered in the acute STEMI as an alternative to delayed assessments,25 considering that the FFR tends to decrease and the iFR tends to increase. The FFR could guide the revascularization of positive lesions (FFR ≤ 0.80).25 In patients with a FFR > 0.80, acute iFR assessment can be used to delay the revascularization of negative NCL (iFR > 0.89).24 In the remaining cases (iFR ≤ 0.89), some authors suggested a staged reevaluation.24 At least 5 days after the index procedure should go by. This was the minimum time needed to observe the initial resolution of acute physiological disturbances.24
Finally, when plaques are correctly identified as functionally negative, they may still be vulnerable and associated with adverse events. NCL exhibiting thin-cap fibroatheromas as defined by optical coherence tomography, and having a muQFR ≤ 0.80, showed the highest event rate,40 which suggests that imaging can offer additional prognostic information.
PCSK9 inhibitors have shown minimal impact on coronary physiology, despite greatly reducing low-density lipoprotein-cholesterol (LDL-C) levels. A large treatment effect on HIST only,19 minor flow limitation at baseline, and microvascular compensation may account for this finding.13
However, combining alirocumab with HIST resulted in a greater increase in cap thickness of fibroatheromas vs statin monotherapy as assessed by optical coherence tomography.41 Moreover, lower LDL-C levels after an ACS are associated with the occurrence of fewer cardiovascular events.2 Therefore, PCSK9 inhibitor treatment is recommended in patients who do not reach their LDL-C target despite maximum tolerated statin and ezetimibe therapy.2
The wide variety of indices to assess coronary physiology has led to a lack of evidence on some of them; similarly, few studies made direct comparisons among such indices.
Our evaluations are mainly based on observational studies with a very different follow-ups.
Angiography-based methods frequently exhibited bias due to their retrospective analysis. Some patients were excluded because of the poor quality of angiographies or anatomic issues, such as ostial lesion or severe vascular tortuosity. Some angiographies were not obtained optimally according to the specific acquisition guide.
The assessment of functional indices for NCL during the initial procedure for STEMI is not absolutely reliable. This evidence is due to potential variability of the FFR, the iFR, and the QFR outside the acute phase. Although variation was not significant for muQFR, resting Pd/Pa, and vFFR, retrospective and/or limited data limit the generalizability of these findings.
Both the FFR and the iFR showed consistent directions of change. Therefore, during an acute STEMI, the FFR can guide the revascularization of positive NCL, while the iFR can help defer revascularization of negative NCL. A negative FFR with a positive iFR should be reevaluated.
The FFR shows robust data supporting its use in NLC of NSTEMI during the acute phase, meaning that it is a more reliable index for initial ACS procedures.
Search string for Google Scholar: “acute coronary syndrome”|”myocardial infarction” “fractional flow reserve”|FFR| “hyperemic ind”|”resting ind”|iFR|”instantaneous wave-free ratio”| “angiography-based ind”|”angiography-derived ind”|QFR|”quantitative flow ratio”|OFR staged|repeated|later. The remaining search strings are available upon request.
None declared.
Ethical committee and patient’s informed consent: not applicable. We followed the SAGER guidelines with respect to possible sex/gender bias.
Microsoft Copilot was used to help edit the English version of the text.
F. Vergni designed the work. F. Vergni, S. Buscarini, L. Ciurlanti, and F.L. Gurgoglione contributed to data acquisition (screening, and/or extraction). F. Vergni, and L. Ciurlanti conducted the critical appraisal. F. Vergni, and S. Buscarini contributed to data interpretation. F. Vergni, and F.L. Gurgoglione drafted, edited and reviewed the work. F. Vergni, S. Buscarini, L. Ciurlanti, F.L. Gurgoglione, F. Pellone, and M. Luzi approved the final version for publication.
None declared.
1. Benatti G, Gragnano F, Vignali L, CalabròP, Gurgoglione FL, Niccoli G. Timing and modality of complete revascularization in patients presenting with ST-segment elevation myocardial infarction and multivessel coronary artery disease. Int J Cardiol. 2023;380:6-11.
2. Byrne RA, Rossello X, Coughlan JJ, et al. 2023 ESC Guidelines for the management of acute coronary syndromes. Eur Heart J. 2023;44:3720-3826. Published correction appears in Eur Heart J. 2024;45:1145.
3. Koo BK, Hwang D, Park S, et al. Practical Application of Coronary Physiologic Assessment:Asia-Pacific Expert Consensus Document:Part 2. JACC Asia. 2023;3:825-842.
4. Mejía-Rentería H, Lee JM, van der Hoeven NW, et al. Coronary Microcirculation Downstream Non-Infarct-Related Arteries in the Subacute Phase of Myocardial Infarction:Implications for Physiology-Guided Revascularization. J Am Heart Assoc. 2019;8:011534.
5. Takenaka H, Okamura T, Miyazaki Y, et al. Serial changes in the quantitative flow ratio in patients with intermediate residual stenosis after percutaneous coronary intervention. Heart Vessels. 2022;37:363-373.
6. Cardiovascular Research Foundation. Conference News. Available at: https://www.tctmd.com. Accessed 30 Mar 2025.
7. Clinical Trial Results. Slide Library. Available at: https://clinicaltrialresults.org. Accessed 30 Mar 2025.
8. Page MJ, McKenzie JE, Bossuyt PM, et al. The PRISMA 2020 statement:an updated guideline for reporting systematic reviews. BMJ. 2021;372:71.
9. Moola S, Munn Z, Tufanaru C, et al. Chapter 7:systematic reviews of etiology and risk. In:Aromataris E, Munn Z, editors. JBI Manual for Evidence Synthesis. Adelaide:JBI;2020.
10. Barker TH, Habibi N, Aromataris E, et al. The revised JBI critical appraisal tool for the assessment of risk of bias for quasi-experimental studies. JBI Evid Synth. 2024;22:378-388.
11. Barker TH, Stone JC, Sears K, et al. The revised JBI critical appraisal tool for the assessment of risk of bias for randomized controlled trials. JBI Evid Synth. 2023;21:494-506.
12. Wan X, Wang W, Liu J, Tong T. Estimating the sample mean and standard deviation from the sample size, median, range and/or interquartile range. BMC Med Res Methodol. 2014;14:135.
13. Bär S, Kavaliauskaite R, Otsuka T, et al. Impact of alirocumab on plaque regression and haemodynamics of non-culprit arteries in patients with acute myocardial infarction:a prespecified substudy of the PACMAN-AMI trial. EuroIntervention. 2023;19:286-296.
14. Cortés C, Rodríguez-Gabella T, Gutiérrez H, et al. Quantitative flow ratio in myocardial infarction for the evaluation of non-infarct-related arteries. The QIMERA pilot study. REC Interv Cardiol. 2019;1:13-20.
15. Erbay A, Penzel L, Abdelwahed YS, et al. Feasibility and diagnostic reliability of quantitative flow ratio in the assessment of non-culprit lesions in acute coronary syndrome. Int J Cardiovasc Imaging. 2021;37:1815-1823.
16. Hou S, Zhu X, Zhao Q, et al. Quantitative flow ratio-guided staged percutaneous coronary intervention in patients with ST-segment elevation myocardial infarction. Heliyon. 2024;10:39335.
17. Huang J, Groenland FTW, Scoccia A, et al. Acute-setting vs. -setting vessel fractional flow reserve of intermediate non-culprit lesions in patients with ST-segment elevation myocardial infarction (FAST STAGED study). Int J Cardiol Heart Vasc. 2023;45:101192.
18. Kirigaya H, Okada K, Hibi K, et al. Diagnostic performance and limitation of quantitative flow ratio for functional assessment of intermediate coronary stenosis. J Cardiol. 2021;77:492-499.
19. Mensink F, Los J, van Geuns RJ. Functional and morphological changes of significant non-culprit coronary artery stenosis by extensive LDL-C reduction with PCSK9 inhibitors. Results of the randomized, placebo-controlled FITTER trial. In:ESC Congress 2024;2024 30 August - 2 September;London, United Kingdom. Available at: https://clinicaltrialresults.org/slide-library/.
20. Musto C, De Felice F, Rigattieri S, et al. Instantaneous wave-free ratio and fractional flow reserve for the assessment of nonculprit lesions during the index procedure in patients with ST-segment elevation myocardial infarction:The WAVE study. Am Heart J. 2017;193:63-69.
21. Ntalianis A, Sels JW, Davidavicius G, et al. Fractional flow reserve for the assessment of nonculprit coronary artery stenoses in patients with acute myocardial infarction. JACC Cardiovasc Interv. 2010;3:1274-1281.
22. Sejr-Hansen M, Westra J, Thim T, et al. Quantitative flow ratio for immediate assessment of nonculprit lesions in patients with ST-segment elevation myocardial infarction-An iSTemI substudy. Catheter Cardiovasc Interv. 2019;94:686-692.
23. Shukla A, Dwivedi SK, Chandra S, et al. Reliability of Fractional Flow Reserve in Non-Infarct-Related Arteries in ST-Segment Elevation Myocardial Infarction Patients Undergoing a Pharmaco-Invasive Approach. Cureus. 2024;16:52668.
24. Thim T, Götberg M, Fröbert O, et al. Nonculprit Stenosis Evaluation Using Instantaneous Wave-Free Ratio in Patients With ST-Segment Elevation Myocardial Infarction. JACC Cardiovasc Interv. 2017;10:2528-2535.
25. der Hoeven NW, Janssens GN, de Waard GA, et al. Temporal Changes in Coronary Hyperemic and Resting Hemodynamic Indices in Nonculprit Vessels of Patients With ST-Segment Elevation Myocardial Infarction. JAMA Cardiol. 2019;4:736-744.
26. Wang L, Travieso A, van der Hoeven N, et al. Improved Nonculprit Stenosis Assessment in Patients With ST-Segment Elevation Myocardial Infarction Using Quantitative Flow Ratio. JACC Cardiovasc Interv. 2023;16:1828-1830.
27. Zhao Q, Sun S, Zhou F, Yue J, Luo X, Qu X. The Inhibition of Evolocumab on Non-Infarct-Related Artery Disease in Patients with ST-Elevation Myocardial Infarction. Int J Gen Med. 2023;16:2771-2781.
28. Barauskas M, Žiubryte·G, Jodka N, Unikas R. Quantitative Flow Ratio for Assessment of Non-Culprit Coronary Artery Lesions During Percutaneous Coronary Intervention (PCI) in 79 Patients Diagnosed with ST-Elevation Myocardial Infarction (STemI):A Study from a Single Center in Lithuania. Med Sci Monit. 2023;29:939360.
29. Jo YS, Moon H, Park K. Different Microcirculation Response Between Culprit and Non-Culprit Vessels in Patients With Acute Coronary Syndrome. J Am Heart Assoc. 2020;9:015507.
30. Li X, Mi L, Duan J, Tao L, Xu X, Wang G. Murray law-based quantitative flow ratio for assessment of nonculprit lesions in patients with ST-segment elevation myocardial infarction. Cardiol J. 2024;31:522-527.
31. Park K, Cho YR, Park JS, Park TH, Kim MH, Kim YD. Comparison of the Effects of Ticagrelor and Clopidogrel on Microvascular Dysfunction in Patients With Acute Coronary Syndrome Using Invasive Physiologic Indices. Circ Cardiovasc Interv. 2019;12:008105.
32. Spitaleri G, Tebaldi M, Biscaglia S, et al. Quantitative Flow Ratio Identifies Nonculprit Coronary Lesions Requiring Revascularization in Patients With ST-Segment-Elevation Myocardial Infarction and Multivessel Disease. Circ Cardiovasc Interv. 2018;11:006023.
33. Mensink FB, Los J, Oemrawsingh RM, et al. Functional and morphological improvement of significant non-culprit coronary artery stenosis by LDL-C reduction with a PCSK9 antibody:Rationale and design of the randomized FITTER trial. Heliyon. 2024;10:38077.
34. Biscaglia S, Guiducci V, Escaned J, et al. Complete or Culprit-Only PCI in Older Patients with Myocardial Infarction. N Engl J Med. 2023;389:889-898.
35. Lee JM, Kim HK, Park KH, et al. Fractional flow reserve versus angiography-guided strategy in acute myocardial infarction with multivessel disease:a randomized trial. Eur Heart J. 2023;44:473-484.
36. Böhm F, Mogensen B, Engstrøm T, et al. FFR-Guided Complete or Culprit-Only PCI in Patients with Myocardial Infarction. N Engl J Med. 2024;390:1481-1492.
37. Smits PC, Abdel-Wahab M, Neumann FJ, et al. Fractional Flow Reserve-Guided Multivessel Angioplasty in Myocardial Infarction. N Engl J Med. 2017;376:1234-1244.
38. Engstrøm T, Kelbæk H, Helqvist S, et al. Complete revascularisation versus treatment of the culprit lesion only in patients with ST-segment elevation myocardial infarction and multivessel disease (DANAMI-3—PRIMULTI):an open-label, randomised controlled trial. Lancet. 2015;386:665-671.
39. Puymirat E, Cayla G, Simon T, et al. Multivessel PCI Guided by FFR or Angiography for Myocardial Infarction. N Engl J Med. 2021;385:297-308.
40. Xu X, Fang C, Jiang S, et al. Functional or anatomical assessment of non-culprit lesions in acute myocardial infarction. EuroIntervention. 2025;21:217-228.
41. Räber L, Ueki Y, Otsuka T, et al. Effect of Alirocumab Added to High-Intensity Statin Therapy on Coronary Atherosclerosis in Patients With Acute Myocardial Infarction:The PACMAN-AMI Randomized Clinical Trial. JAMA. 2022;327:1771-1781.
Introduction and objectives: Ultrasound renal denervation (uRDN) has emerged as an innovative therapeutic approach for the treatment of hypertension. However, its efficacy compared to medication remains uncertain. We aimed to assess the efficacy profile of uRDN vs sham groups focusing on its impact on daytime ambulatory blood pressure, 24-hour blood pressure, home blood pressure and office blood pressure.
Methods: We conducted a systematic search across Embase, PubMed, and Cochrane Library databases from their inception up 1 November 2024 to identify randomized controlled trials evaluating the efficacy of uRDN. Statistical analyses were performed using RevMan 6.3 software, utilizing the mean and standard deviation method to calculate mean differences with a 95% confidence interval (95%CI).
Results: A total of 4 studies were included in the final analysis with 642 patients. uRDN significantly reduced daytime ambulatory systolic blood pressure (SBP) (−5.12 mmHg; 95%CI, −6.07 to −4.16; P ≤ .00001), 24-h SBP (−4.87 mmHg; 95%CI, −6.53 to −3.21]; P ≤ .00001), office SBP (−5.03 mmHg; 95%CI, −6.27 to −3.79; P ≤ .00001) and showed a decrease in patient medication 6 months after the procedure.
Conclusions: Using uRDN leads to a lower blood pressure in patients within 2 months following the procedure. Additionally, after 6 months a significant decrease in drug use is observed.
This meta-analysis protocol was registered on PROSPERO on 7 July 2024 (CRD42024562852).
Keywords: Resistant hypertension. Ultrasound renal denervation. Systolic blood pressure. Diastolic blood pressure. Antihypertensive treatments.
Introducción y objetivos: La denervación renal por ultrasonido (DRU) ha surgido como un enfoque terapéutico innovador para la hipertensión arterial resistente. Sin embargo, su eficacia en comparación con la medicación sigue siendo incierta. Nuestro objetivo fue evaluar la eficacia de la DRU frente a grupos simulados, con especial atención a su impacto sobre la presión arterial ambulatoria diurna, la presión arterial de 24 h, la presión arterial domiciliaria y la presión arterial en el consultorio.
Métodos: Se realizó una búsqueda sistemática en las bases de datos Embase, PubMed y Cochrane Library hasta el 1 de noviembre de 2024, para identificar ensayos controlados aleatorizados que evaluaran la efectividad de la DRU. Los análisis estadísticos se realizaron con el programa informático RevMan 6.3, utilizando la media y la desviación estándar para calcular las diferencias de medias con un intervalo de confianza del 95% (IC95%).
Resultados: En el análisis final se incluyeron cuatro estudios con 642 pacientes. La DRU redujo de manera significativa la presión arterial sistólica (PAS) ambulatoria diurna (−5,12 mmHg; IC95%, −6,07 a −4,16; p ≤ 0,00001), la PAS de 24 h (−4,87 mmHg; IC95%, −6,53 a −3,21; p ≤ 0,00001) y la PAS en la consulta (−5,03 mmHg; IC95%, −6,27 a −3,79; p ≤ 0,00001), y logró una disminución de la medicación de los pacientes a los 6 meses del procedimiento.
Conclusiones: El uso de DRU conlleva una reducción de la presión arterial a los 2 meses del procedimiento. Adicionalmente, transcurridos 6 meses se observó una disminución significativa del uso de medicación.
El protocolo de este metanálisis fue registrado en PROSPERO el 7 de julio de 2024 (CRD42024562852).
Palabras clave: Hipertensión resistente. Denervación renal por ultrasonido. Presión arterial sistólica. Presión arterial diastólica. Tratamiento antihipertensivo.
Abbreviations
BP: blood pressure. DBP: diastolic blood pressure. SBP: systolic blood pressure. RCT: randomized controlled trial. uRDN: ultrasound renal denervation.
Hypertension is highly prevalent worldwide and well recognized as a major risk factor for cardiovascular, cerebrovascular, and renal complications.1 Despite the availability of numerous antihypertensive drugs that effectively mitigate hypertension-related organ damage,1,2 a substantial proportion of patients fail to attain adequate blood pressure (BP) control,3 which may be attributed to factors such as medication non-adherence or the presence of resistant hypertension,4,5 which is defined as the presence of uncontrolled BP of, at least, 130/80 mmHg despite the simultaneous prescription of, at least, 3 or 4 antihypertensive drugs of different classes, or controlled BP despite the prescription of, at least, 4 drugs, at the maximum tolerated doses, including a diuretic.6 The pathophysiology of hypertension is intricate and includes a diverse array of mechanisms, with sympathetic overdrive emerging as a pertinent factor in all forms of hypertension.7 Consequently, novel therapeutic approaches have emerged, including renal denervation (RDN), which aims to decrease renal sympathetic activity thereby reducing BP. RDN has drawn considerable attention as a guideline-recommended BP lowering treatment along with lifestyle changes and pharmacotherapy for patients with resistant hypertension.8,9 Recently, there has been growing consensus that RDN should also be considered for individuals whose hypertension is due to no therapeutic adherence.10-12 Early randomized controlled clinical trials yielded inconsistent findings on the efficacy profile of the intervention, with a substantial proportion of patients failing to respond across the trials.13,14 Potential explanations for the heterogeneous results include insufficient operator experience using the Symplicity Flex catheter (Medtronic, United States), the study participants’ baseline characteristics, and changes of antihypertensive medication.15 Subsequently, sham-controlled trials with better study designs, catheter technologies and procedural techniques have improved the BP-lowering safety and efficacy profile of RDN.16-18 Currently, various catheter systems are used for RDN, utilizing different technologies, such as radiofrequency-based systems like Symplicity Spyral (Medtronic, United States). Ultrasound-based catheters have also been developed, such as the Paradise (Recor Medical, United States), whose efficacy has been evaluated in multiple studies. Finally, there is a system based on alcohol-mediated RDN.19 Recently, the U.S. Food and Drug Administration (FDA) approved Medtronic Symplicity Spyral and Recor Paradise system as adjuvant therapies for the treatment of hypertension.20
The efficacy of the latter was evaluated in a multicenter, randomized, blinded and sham-controlled trial. Subsequently, it was determined in the REQUIRE RADIANCE-HTN SOLO,16 RADIANCE HTN TRIO17 and RADIANCE II,18 and REQUIRE21 trials. Results were heterogeneous between the RADIANCE and REQUIRE trials, which had limitations that may account for the varied results.10 Finally, uRDN was concluded to be safe for the treatment of hypertension, even in patients with resistant hypertension and poor medical adherence.19 The aim of this study is to conduct a systematic review and a meta-analysis to examine the antihypertensive efficacy of uRDN in patients with hypertension vs a sham group treatment.
We conducted a systematic review and meta-analysis which strictly followed the clinical practice guidelines established by the Preferred Reporting Items for Systematic Reviews and Meta-Analyses (PRISMA) statement.22 Methodological procedures were conducted in full compliance with the Cochrane Handbook of Systematic Reviews and Meta-Analysis of Interventions. This meta-analysis protocol was registered on PROSPERO 7 July 2024, under protocol ID: CRD42024562852.
Inclusion criteria were established to identify relevant studies: patients with resistant hypertension and randomized controlled trials (RCTs) comparing uRDN with sham groups, which did not undergo uRDN; RCTs reporting office, daytime ambulatory, home and 24-h ambulatory BP changes from baseline were included. We excluded those underreporting, at least, 1 of the following outcomes of interest: changes in BP between baseline and, at least, a 2-month follow up. In addition, we excluded non-English publications, case-control studies, case reports, single arm studies, letters to the editors, basic science research, meta-analyses, and review articles.
We conducted a comprehensive search across PubMed, EMBASE, and COCHRANE, from their inception until 1 November 2024. Keywords and free-text terms were used to explore literature on hypertension, renal denervation, and ultrasound ablation. Detailed search information for each database is provided in the Search strategy section of the supplementary data.
Initially, a comprehensive database search was conducted to compile all relevant records. Duplicate entries were, then, manually removed using Zotero software. Afterwards, references were screened by title and abstract. When necessary, a full-text review was performed to ensure relevance and accuracy. Two authors (C. J. Palomino-Ojeda and L. H. García-Mena) independently assessed each the inclusion and quality of each article. Discrepancies were resolved by a third author (J. M. Guerrero-Hernández). Additionally, references cited in the included studies were scrutinized and included if they fulfilled the eligibility criteria.
Data extraction was conducted using Excel spreadsheets to record the following information: a) baseline characteristics of the study population, b) summaries detailing the characteristics of the included studies, c) outcome measures, and d) domains evaluated for quality assessment.
Randomized controlled trials were assessed using Version 2 of the Cochrane risk-of-bias tool for randomized trials (RoB 2)22,23 from the Cochrane Handbook of Systematic Reviews of Interventions. Our analysis included a funnel plot for the primary endpoint daytime ambulatory systolic blood pressure (SBP) shown in figure 1 of the supplementary data.

Figure 1. PRISMA flow diagram. RDN, renal denervation.
BP changes were assessed by comparing baseline values and follow-up measurements taken, at least, 2 months later. The mean difference was analyzed using the mean and standard deviation.
The efficacy profile of uRDN vs the sham control was analyzed using continuous data to calculate the mean difference with its corresponding 95% confidence interval (95%CI).24 This analysis assessed BP changes across groups with an, at least, 2-month follow-up while evaluating their mean difference.
Furthermore, an examination was conducted to discern any variation among office BP, ambulatory daytime BP, 24-h ambulatory BP, nighttime ambulatory BP, and home BP outcomes in trials that reported these results. This was achieved by computing the mean and its associated standard deviation for the difference between the 2 outcomes. The validated Campbell calculator was used to convert the measures of dispersion from the outcomes in the REQUIRE trial for data analysis.24 The level of heterogeneity was assessed using the I2 statistic.
Sensitivity analyses were conducted using a random effects model to account for variability among studies.25 Subgroup analyses were predefined for first and second-generation RDN trials, with tests for interaction for the primary endpoint.
Heterogeneity among the included studies was assessed using Cochran’s Q statistic. Additionally, the I2 statistic was used to quantify the proportion of total variation attributed to heterogeneity, with values > 50% indicating high heterogeneity. All statistical analyses (including the calculation of standardized mean difference, relative risk, and mean difference) were performed using RevMan 6.3. software.22
A total of 448 studies were identified across database searches. A total of 392 studies were screened after removing duplicate studies, 388 of which were excluded due to single-arm study (n = 6); publication in a language different than English (n = 1); case-control or case report studies and literature review (n = 140); basic scientific research (n = 24); editorial letter (n = 8); different type of RDN studies (n = 83); studies with ≤ 10 participants (n = 6); and does not compare intervention of interest (n = 120). Finally, 4 studies meet all inclusion criteria and were eligible for analysis. An analysis of 642 patients from the 4 selected articles was conducted as they met the inclusion criteria. The PRISMA flow diagram of the study selection process is shown in figure 1.
The studies included in our analysis included a total of 4 RCTs published from 2018 through 2023.16-18,21 All studies used uRDN and a sham control group. Two studies were performed in the United States/Europe,16,17 1 study only in the United States18 and the rest in Japan and South Korea.21 The baseline characteristics of the included studies were analyzed and summarized in table 1. Characteristics of the entire patient population are shown in table 2.
Table 1. Baseline characteristics and following intervention of the included studies population.
| Reference | ||||||||
|---|---|---|---|---|---|---|---|---|
| RADIANCE HTN SOLO 201816 | RADIANCE-HTN TRIO 202117 | REQUIRE 202221 | RADIANCE II 202318 | |||||
| Group | uRDN | SHAM control | uRDN | SHAM control | uRDN | SHAM control | uRDN | SHAM control |
| N | 74 | 72 | 69 | 67 | 69 | 67 | 150 | 74 |
| Gender, female | 28 | 33 | 13 | 14 | 21 | 14 | 47 | 17 |
| Gender, male | 46 | 39 | 56 | 53 | 48 | 53 | 103 | 57 |
| Age, years, mean (SD) | 54.4 (10·2) | 53.8 (10·0) | 52.3 (7.5) | 52,8 (9.1) | 50.7 (11.4) | 55.6 (12.1) | 55.1 (9.9) | 54.9 (7.9) |
| Body mass index, mean (SD) | 29.9 (5.9) | 29.9 (5.0) | 32.8 (5.7) | 32.6 (5.4) | 29.5 (5.5) | 28.4 (4.5) | 30.1 (5.2) | 30.6 (5.2) |
| Abdominal obesity | 41 | 44 | 54 | 55 | – | – | 90 | 46 |
| GFR mL/min/1.73 m2 | 84.7 (16.2) | 83.2 (16.1) | 86 (25.2) | 82.2 (19.2) | 74.2 (16.2) | 69.6 (17.1) | 81.4 (14.4) | 82.3 (14.9) |
| GFR < 60 mL/min/1.73 m2 | 1 | 3 | 8 | 7 | 15 | 18 | 7 | 3 |
| Type 2 diabetes mellitus | 2 | 5 | 21 | 17 | 18 | 20 | 9 | 5 |
| Cardiovascular disease | – | – | 8 | 9 | 9 | 9 | 1 | – |
| Systolic BP at office screening, mm Hg | 142.6 (14.7) | 144.6 (15.9) | 161.9 (15.5) | 163.6 (16.8) | 157.6 (19.5) | 160.4 (14.9) | 155.8 (11.1) | 154.3 (10.6) |
| Diastolic BP at office screening, mm Hg | 92.3 (10.1) | Mean 93.6 (8.3) | 105.1 (11.6) | 103.3 (12.7) | 97.7 (16.6) | 95.3 (14.2) | 101.3 (6.7) | 99.1 (5.6) |
| HR at office screening, beats/min | 72 (12.1) | 72.6 (12.3) | 74.5 (11) | 77.6 (12.9) | 75.3 (10.8) | 71.5 (12.8) | 74.1 (12.0) | 73.6 (11.9) |
| Number of antihypertensive drugs at screening | 1: 33 2: 28 3: 1 | 1: 28 2: 27 3: 1 | 3: 27 4: 22 5: 20 | 3: 28 4: 24 5: 15 | 3: 32 4: 20 5: 17 | 3: 29 4: 23 5: 15 | 1: 52 2: 44 > 2: 0 | 1: 25 2: 25 > 2: 1 |
| Procedural time | 72.3 (23.3) | 38.2 (12.6) | 83.66 (22.71) | 41.33 (12.87) | 86.7 (54.0) | 40.2 (11.6) | 76.7 (25.2) | 43.9 (16.6) |
| Office systolic blood pressure at 2 months | 143.7 (16.7) | 149.7 (17.4) | 147.1 (20.3) | 152.1 (22) | – | – | 145.8 (15.9) | 151.2 (16.4) |
| Office diastolic blood pressure at 2 months | 94.2 (10.1) | 98 (10) | 96.6 (13.9) | 98.7 (13.8) | – | – | 96.0 (10.2) | 98.1 (11.2) |
| Daytime ambulatory systolic BP at 2 months | 141.9 (11.9) | 147.9 (13.3) | 141.0 (16.1) | 146.3 (18.8) | – | – | 135.6 (13) | 142.9 (10.5) |
| Daytime ambulatory diastolic BP at 2 months | 87.9 (7.1) | 90.9 (7.9) | 88.5 (11.6) | 90.7 (12.2) | – | – | 83.1 (7.6) | 87.0 (6.3) |
| 24-hour systolic BP at 2 months | 135.6 (11.4) | 140.7 (11.8) | 135.2 (16.0) | 140.5 (18.7) | – | – | 135.6 (13.0) | 142.9 (10.5) |
| 24-hour diastolic BP at 2 months | 83 (6.8) | 85.7 (7.1) | 83.6 (10.9) | 85.8 (12) | – | – | 83.1 (7.6) | 87.0 (6.3) |
| Home systolic BP at 2 months | 139.4 (11.7) | 146.6 (15.4) | 144.6 (18.2) | 149.9 (18.9) | – | – | 143.4 (12.3) | 148.8 (12.3) |
| Home diastolic BP at 2 months | 89.9 (7.8) | 93.3 (8.5) | 93.2 (14.7) | 96 (12.8) | – | – | 92.7 (7.4) | 95.5 (8.1) |
| Nighttime ambulatory systolic BP at 2 months | 125.6 (12.8) | 129.4 (13.1) | 126.3 (18.4) | 76.2 (12.2) | – | – | 125.5 (15.0) | 132.4 (12.2) |
| Nighttime ambulatory diastolic BP at 2 months | 74.8 (8.5) | 77.3 (8.5) | 131.9 (20.9) | 78.4 (13.2) | – | – | 75.1 (9.7) | 79.6 (7.5) |
|
BP, blood pressure; GFR, glomerular filtration rate; SD, standard deviation; uRDN, ultrasound renal denervation. |
||||||||
Table 2. Summary of included studies
| Study ID | Country | Study design | Total population | Compare interventions | Key findings |
|---|---|---|---|---|---|
| United States/Europe | RCT | 146 | uRDN vs SHAM control | Renal denervation resulted in a greater reduction in daytime ambulatory systolic blood pressure compared with a sham procedure | |
| United States/Europe | RCT | 136 | uRDN vs SHAM control | Renal denervation reduced daytime ambulatory systolic blood pressure more than the sham procedure | |
| Japan and South Korea | RCT | 136 | uRDN vs SHAM control | Is the first trial of ultrasound renal denervation in Asian patients with hypertension on antihypertensive therapy | |
| The study did not show a significant difference in ambulatory blood pressure reductions in treated patients with resistant hypertension | |||||
| United States | RCT | 224 | uRDN vs SHAM control | The primary efficacy outcome was the mean change in daytime ambulatory SBP at 2 months | |
| No major adverse events were reported in either group | |||||
|
RCT: randomized controlled trial; SBP, systolic blood pressure; uRDN: ultrasound renal denervation. |
|||||
In the analysis of 642 patients, the mean age was 54.15 years ± 9.95, 70.8% were men, and the mean body mass index was estimated at 30 kg/m2 ± 5.3. Regarding comorbidities, 15.1% had type 2 diabetes mellitus, and 5.6%, cardiovascular disease. The mean glomerular filtration rate (GFR) was estimated at 82.25 mL/min/1.73 m2 ± 16.2. In addition, 9.6% of patients had GFR levels < 60 mL/min/1.73 m2. Of note, eligibility criteria in all trials include an estimated GFR > 40 mL/min/1.73 m2. Two studies— the RADIANCE-HTN SOLO and the RADIANCE II—included patients on 1 to 3 antihypertensive drugs and were designed as “Off Med” studies, meaning patients underwent a washout period with no antihypertensive treatment for 4 weeks in the RADIANCE-HTN SOLO and 8 weeks in the RADIANCE II. Additionally, patients who experienced complications such as high BP were given antihypertensive escape therapy.26 On the other hand, the RADIANCE-HTN TRIO and REQUIRE trials included patients on 3 to 5 antihypertensive drugs and evaluated the uRDN in patients on concomitant antihypertensive therapy. However, only the RADIANCE-HTN TRIO trial standardized antihypertensive treatment over a 4-week regimen with a fixed-dose of 3 drugs in a single pill including amlodipine 10 mg; valsartan 160 mg (or olmesartan 40 mg); and hydrochlorothiazide 25 mg. Additionally, treatment adherence was assessed by mass spectrometry.21,27,28 Enrollment criteria were comparable across the analyzed studies. Similarly, exclusion criteria were consistent in all studies; however, the RADIANCE trials additionally excluded patients with anatomical variations or alterations in renal artery anatomy, as detected on renal computed tomography or magnetic resonance angiography.27 In all studies, patients were blinded prior to the uRDN procedure. Furthermore, in all RADIANCE trials, blinding was implemented after the washout period or after the patients completed the fixed-dose treatment.18,26,27
Patients treated with uRDN for up to 2 months experience a significant reduction of −5.12 mmHg (95%CI, −6.07 to −4.17; P < .00001); I2 = 2%) in daytime ambulatory SBP vs the sham group. Similarly, ambulatory diastolic blood pressure (DBP) dropped down to −2.82 mmHg (95%CI, −3.43 to −2.21; P < .00001; I2 = 0%) in patients with uRDN vs the sham group (figure 2A).

Figure 2. Meta-analysis of the effect of uRDN on blood pressure va a sham control. A: difference in daytime ambulatory BP up to 2 months; B: difference in 24-hour BP up to 2 months; C: difference in office BP up to 2 months; and D: difference in home BP up to 2 months. Forest plots showing the mean difference and SD from random assignments between the uRDN and sham control groups. 95%CI, 95% confidence interval; BP, blood pressure; SD, standard deviation; uRDN, ultrasound renal denervation. The bibliographical references mentioned in this figure correspond to Azizi et al.,16-18 and Kario et al.21
24-h BP was evaluated up to 2 months after uRDN. Analysis of SBP showed a significant reduction of −4.87 mmHg (95%CI, −6.53 to −3.21; P < .00001; I2 = 42%). Meanwhile, 24-h DBP dropped down to −2.55 mmHg (95%CI, −3.83 to −1.26; P < .00001; I2 = 62%) in patients on uRDN (figure 2B).
SBP dropped down to −5.03 mmHg after 2 months (95%CI, −6.27 to −3.79; P < .00001; I2 = 0%) in uRDN patients. DBP showed a significant decrease of −3.68 mmHg (95%CI, −4.57 to −2.78; P < .00001; I2 = 31%) with the uRDN intervention (figure 2C).
Analysis of home BP after 2 months showed a decrease in SBP of −5.47 mmHg (95%CI, −8.08 to −2.85; P < .0001; I2 = 75%), while DBP dropped down to −3.19 mmHg (95%CI, −4.63 to −1.75; P < .0001; I2 = 69%) in patients on uRDN (figure 2D).
Nighttime BP was evaluated at the 2-month follow-up. We found that SBP dropped down to −3.99 mmHg (95%CI, −7.00 to −0.99; P = 0.009; I2 = 70%), while DBP dropped down to −2.30 mmHg (95%CI −4.03 to −0.56; P = .01; I2 = 64%) in patients on uRDN (figure 2 of the supplementary data).
Patient drugs 6 months after uRDN were only reported in the RADIANCE-HTN SOLO and RADIANCE-HTN TRIO clinical trials. Data analysis revealed that uRDN leads to using fewer antihypertensive drugs by −0.52 (95%CI, −0.91 to −0.13; P = 0.009; I2 = 69%) vs the sham control group (figure 3).
Figure 3. Patients on uRDN used less antihypertensive medication prescribed 6 months after the procedure vs the sham group. 95%CI, 95% confidence interval; BP, blood pressure; SD, standard deviation; uRDN, ultrasound renal denervation. The bibliographical references mentioned in this figure correspond to Azizi et al.16 and Azizi et al.17
Among the 4 studies included, the risk of bias remained consistent at a moderate level, which was attributed to the inability to blind the interventional cardiologist conducting the uRDN, although outcome assessors were blinded to the interventions performed. Studies were categorized as having moderate risk16-18,21 (table 3). Data on risk of bias can be found in table 1 of the supplementary data. In addition, the funnel plot of daytime ambulatory SBP (figure 1 of the supplementary data) showed a slight asymmetry, as points tend to concentrate towards the left side of the combined effect, which could suggest a possible publication bias. In addition, the points closer to the vertex represent studies with lower standard error due to a larger sample size. The heterogeneity of the funnel plot reflects variations in effects across studies. Plot points are within the funnel lines, but one of them towards the lower right seems further away from the rest, which could indicate a possible outlier or methodological or population differences.29
Table 3. Risk of bias summary for randomized studies (RoB 2)
| Trials | Risk of bias domains | |||||
|---|---|---|---|---|---|---|
| D1 | D2 | D3 | D4 | D5 | Overall | |
| RADIANCE HTN SOLO16 | Low | Low | Low | Low | Low | Low |
| RADIANCE HTN TRIO17 | Low | Low | Low | Low | Low | Low |
| REQUIRE21 | Low | Low | Low | Low | Low | Low |
| RADIANCE II18 | Some concerns | Low | Low | Low | Low | Some concerns |
|
D1: bias arising from the randomization process. D2: bias due to deviation from intended intervention. D3: bias due to missing outcome data. D4: bias in outcome measurement. D5: bias in selection of the reported result. |
||||||
This meta-analysis includes data from 4 randomized controlled trials that evaluated the efficacy profile of uRDN in patients with true resistant hypertension and off-medication hypertensive patients vs a sham group. Antihypertensive efficacy was evaluated across different clinical settings such as 24-h ambulatory BP, home BP, office BP, and daytime BP. Our results demonstrated significant BP-lowering efficacy at the 2-month follow-up vs the sham procedure. Furthermore, at the 6-month follow-up, fewer antihypertensive drugs were prescribed to patients on uRDN vs those from the sham group. These results support the use of uRDN as an adjuvant therapy for hypertension and as a valuable option for reducing BP as well as the number of antihypertensive drugs.
Previous studies have demonstrated the safety profile of RDN for the treatment of resistant hypertension, such as the first-generation SIMPLICITY HTN trials.30 However, the SIMPLICITY HTN-3 study showed no differences in the 24-h BP reduction vs the sham group, casting doubts on the benefits of RDN.14 Subsequently, new catheters were developed for performing RDN, and standardized criteria were established for conducting RDN trials with a sham group.12,19 Currently, uRDN has emerged as a novel option as an adjuvant therapy treatment of hypertension. It is based on catheter systems, such as the TIVUS and Paradise systems, which utilize ultrasound energy for the thermal ablation of afferent and efferent renal nerves.19,31
Our results demonstrated a reduction in both SBP and DBP at the 2-month follow-up, with a more pronounced effect on SBP in patients on uRDN vs the sham control group. We observed a reduction of −5.12 mmHg in ambulatory SBP, −4.87 mmHg in 24-h SBP, −5.03 mmHg in office SBP, and −5.47 mmHg in home SBP. These findings are particularly relevant since SBP has turned out to be a strong predictor of future cardiovascular events and mortality, regardless of age in adults.32 The CI values for home BPS had the widest range. Furthermore, the RADIANCE HTN-SOLO trial demonstrated a wide CI in both office and home SBP. This observation is an opportunity for future trials to focus on patient training to standardize home BP measurement since day-to-day home BP has been proposed as a potential predictor of cardiovascular disease.33
Although the observed BP reduction may seem minimal and lack significant clinical relevance, it is important to note that these findings reflect the first 2 months of follow-up after uRDN initiation and literature reports that uRDN has a sustained long-term effect on lowering BP values. For example, the HTN RADIANCE-SOLO trial demonstrated that at the 36-month follow-up, office BP decreased 18/11 ± 15/9 mmHg.34 Related to this, previous studies have demonstrated that a 10 mmHg reduction in SBP is associated with a decrease in the relative risk (RR) of major cardiovascular events (RR, 0.80; 95%CI, 0.77-0.83), coronary heart disease (RR, 0.83; 95%CI, 0.78-0.88), stroke (RR, 0.73; 95%CI, 0.68-0.77), heart failure (RR, 0.72; 95%CI, 0.67-0.78), and a 13% reduction in all-cause mortality rate (RR, 0.87; 95%CI 0.84-0.91).2 However, it has recently been reported that even a 5 mmHg decrease is beneficial to reduce the risk of major cardiovascular events, estimating a hazard ratio (HR) of 0.91 (95%CI, 0.89-0.94) for individuals without previous cardiovascular disease and a HR of 0.89 (95%CI, 0.86-0.92) for those with previous cardiovascular disease.1 In addition, reduction of preventable major cardiovascular events by treating hypertension has a positive economic impact in reducing hospitalization expenses due to complications such as heart attack or stroke.35 Hypertension is a prevalent global health concern, and effective BP control is achieved in only 21% of patients.36 In the United States, individuals with hypertension are estimated to incur an additional $2500 to $3000 in annual expenses vs those without hypertension. Maintaining normal BP not only benefits patients but also supports the economic well-being of the entire health care system.37 In fact, studies evaluating the cost-effectiveness of long-term use of radiofrequency RDN have been conducted in the United States and the United Kingdom concluding that this procedure represents a cost-effective option for the treatment of uncontrolled and resistant hypertension, as its sustained BP-lowering effect favors the reduction of cardiovascular morbidity and mortality.38 Similarly, in Spain, an estimate was made of the impact of radiofrequency RDN on quality-adjusted life years, cardiac events, and patient-related lifetime costs. Radiofrequency RDN was found to reduce the risk of stroke (RR, 0.80), myocardial infarction (RR, 0.88), and heart failure (RR, 0.72) throughout a 10-year period, resulting in improved health outcomes and long-term cost savings. Results presented indicate that radiofrequency RDN is a cost-effective therapeutic option that should be taken into consideration in patients with uncontrolled hypertension, including resistant hypertension.39
In addition to the reduction in BP and the positive cost-effectiveness of uRDN, radiofrequency RDN has been demonstrated to be a safe procedure for the patients. The clinical trials that analyzed this meta-analysis found no safety differences between the treated and sham groups. Furthermore, few postoperative adverse events were reported. Most complications were associated with back pain, which was effectively and uneventfully managed.16-18,21 The long-term safety profile of the procedure has been consistently reported, with no adverse effects being reported from uRDN observed at the 1, 3-, and even 8-year follow-up.34,40,41
Our findings also demonstrated that, at the 6-month follow-up, patients on uRDN used fewer prescribed antihypertensive drugs, which suggests that treatment may potentially improve patient outcomes. However, this outcome was only evaluated in the RADIANCE HTN-TRIO and RADIANCE HTN-SOLO trials. In addition, at the 3-year follow-up the RADIANCE HTN-TRIO reported no differences in the number of drugs used by patients initially identified with uncontrolled hypertension, although they decreased office SBP by 10.8 mmHg.34 This is particularly noteworthy as non-adherence to therapy is a significant contributing factor to uncontrolled BP.42 However, the results suggest that the greatest benefit is observed in the maintenance of low BP levels rather than in the decrease in the number of antihypertensive drugs prescribed.
Of note, the I2 value of the outcomes evaluated showed that daytime SBP and DBP had low heterogeneity, while the 24-h SBP and DBP values had moderate-to-high heterogeneity. On the other hand, office SBP and DBP had low-to-moderate heterogeneity. Finally, home SBP and DBP, as well as nighttime SBP and DBP and drug intake had high heterogeneity. Variations in heterogeneity do not necessarily indicate that the results are not useful;43 possibly, the differences in the heterogeneity of the outcomes assessed is due to differences in the methodology of the studies contemplated in this meta-analysis, which will be discussed below.
Our analysis included the REQUIRE trial, which has certain limitations, such as the absence of a blinded design, a non-standardized uRDN intervention, and dose titration. These factors may have introduced bias, potentially explaining the lack of differences observed between the uRDN and sham groups. In addition, the inclusion criteria of the study did not consider the presence of anatomical variations in the renal arteries vs the RADIANCE trials in which an exclusion criterion is the presence of anatomical variations in renal arteries. This factor, along with therapeutic adherence, could impact the BP reduction results.21,28,44 Based on this perspective, the European Society of Cardiology (ESC) Council on Hypertension and the European Association of Percutaneous Cardiovascular Interventions (EAPCI) have established the characteristics that must be met by studies evaluating RDN with a sham control group to be considered as high quality: a) multicenter design; b) blinding of patients; c) ambulatory BP change as the primary enpoint; d) use of second-generation RDN systems.10 In this context, RADIANCE clinical trials are characterized by a rigorous methodological protocol, which required a 4- or 8-week stabilization of pharmacological therapy prior to randomization to either uRDN or a sham procedure.45,46 Furthermore, RADIANCE trials monitored therapeutic adherence and were designed to assess the effect of uRDN with and without antihypertensive treatment, minimizing the confounding effects.28,47
A key long-term challenge of the RADIANCE trials is to demonstrate sustained BP-lowering effects vs sham groups. Follow-up studies show that patients from the sham group required higher doses of antihypertensive drugs, while those on uRDN used fewer drugs. Although BP differences across groups decreased throughout time, uRDN patients consistently needed fewer prescriptions.26,27
Results from the RADIANCE trials demonstrate the efficacy profile of uRDN for the treatment of resistant hypertension and patients with poor therapeutic adherence, as observed in the off-study population. Additionally, the REQUIRE trial highlights the potential role of anatomical variations in determining patient suitability for uRDN, underscoring the importance of selecting appropriate criteria for patient selection. In addition, RDN has proven to be a safe procedure with a positive long-term cost-benefit ratio. The key question on uRDN may be: Which patient group would benefit most from uRDN, considering anatomical factors and therapeutic adherence?
To make the most out of the study results, it is important to consider its limitations: a) we only analyzed data from trials that used uRDN, which reduces the size of the population; b) data availability from the studies considered covered a short follow-up period, which limits the ability to determine the long-term antihypertensive efficacy of uRDN; c) differences in supervised drug adherence across the methodological designs limit their applicability to real-world settings; d) Since RCTs included patients with true resistant hypertension and off-med hypertension, the heterogeneous population limits the generalizability of the results to a specific hypertension subtype; and e) The funnel plot showed asymmetry, suggesting a possible publication bias, although results should be interpreted with caution because the funnel plot also indicates that there is a limited amount of data.
This meta-analysis demonstrates that uRDN treatment effectively reduces both SBP and DBP across various contexts, including 24-h, ambulatory, home and office BP at the initial 2-month follow-up in hypertensive patients (figure 4). Additionally, uRDN was associated with reduced antihypertensive drug use 6 months after the procedure. However, further research is needed to assess its long-term effects and identify the patient groups who may benefit the most.

Figure 4. Central illustration. Summary of the effect on the decrease in systolic and diastolic blood pressure in patients on uRDN compared with patients who received the sham procedure at the 2 months postoperative follow-up. uRDN, ultrasound renal denervation.
This manuscript did not receive financial support from any institution or funding agency for its preparation.
The present meta-analysis was conducted based on previously published studies. As the study involved secondary data analysis, no new data was collected from human participants or animals, and the use of SAGER guidelines does not apply to this study. Therefore, ethical approval was deemed unnecessary. All included studies were reviewed in full compliance with ethical guidelines set forth by the respective institutions where the original studies were conducted. All authors state that the data used in this study were obtained exclusively from publicly accessible sources, and no confidential or proprietary information was utilized without appropriate authorization.
During the preparation of this work the authors used ChatGPT-4o to review the document syntaxis and grammar. After using this tool/service, the authors reviewed and edited the content as needed and took full responsibility for the content of the published article.
J.M. Guerrero-Hernández: conceptualization, formal analysis, drafting, review and editing; C. J. Palomino-Ojeda: methodology, investigation, drafting, review and editing; L. H. García-Mena: methodology, formal analysis, writing, review and editing; Ó.Á. Vedia-Cruz: investigation; J. L. Maldonado-García: drafting, review and editing; I. J. Núñez-Gil: investigation, supervision and review; J. A. García-Donaire: review and supervision.
I. J. Núñez-Gil served as a consultant for Medtronic and Recor Medical in the denervation field. J. A. García-Donaire served as consultant for Medtronic and Recor Medical in the denervation field. The rest of the authors declared no conflicts of interest whatsoever.
1. Adler A, Agodoa L, Algra A, et al. Pharmacological blood pressure lowering for primary and secondary prevention of cardiovascular disease across different levels of blood pressure:an individual participant-level data meta-analysis. The Lancet. 2021;39:1625-1636.
2. Ettehad D, Emdin CA, Kiran A, et al. Blood pressure lowering for prevention of cardiovascular disease and death:A systematic review and meta-analysis. The Lancet. 2016;387:957-967.
3. Carey RM, Muntner P, Bosworth HB, Whelton PK. Prevention and Control of Hypertension:JACC Health Promotion Series. J Am Coll Cardiol. 2018;72:1278-1293.
4. Choudhry NK, Kronish IM, Vongpatanasin W, et al. Medication adherence and blood pressure control:A scientific statement from the american heart association. Hypertension. 2022;79:E1-E14.
5. Egan BM, Zhao Y, Li J, et al. Prevalence of optimal treatment regimens in patients with apparent treatment-resistant hypertension based on office blood pressure in a community-based practice network. Hypertension. 2013;62:691-697.
6. Flack JM, Buhnerkempe MG, Moore KT. Resistant Hypertension:Disease Burden and Emerging Treatment Options. Curr Hypertens Rep. 2024;26:183-199.
7. Grassi G, Ram VS. Evidence for a critical role of the sympathetic nervous system in hypertension. J Am Soc Hypertens. 2016;10:457-466.
8. Mabin T, Sapoval M, Cabane V, Stemmett J, Iyer M. First experience with endovascular ultrasound renal denervation for the treatment of resistant hypertension. EuroIntervention. 2012;8:57-61.
9. Dasgupta I, Sharp ASP. Renal sympathetic denervation for treatment of hypertension:where are we now in 2019? Curr Opin Nephrol Hypertens. 2019;28:498-506.
10. Barbato E, Azizi M, Schmieder RE, et al. Renal denervation in the management of hypertension in adults. A clinical consensus statement of the ESC Council on Hypertension and the European Association of Percutaneous Cardiovascular Interventions (EAPCI). Eur Heart J. 2023;44:1313-1330.
11. Rodríguez-Leor O, Jaén-Águila F, Segura J, et al. Renal denervation for the management of hypertension. Joint position statement from the SEH-LELHA and the ACI-SEC. REC Interv Cardiol. 2022;4:39-46.
12. Schmieder R, Burnier M, East C, Tsioufis K, Delaney S. Renal Denervation:A Practical Guide for Health Professionals Managing Hypertension. Interv Cardiol. 2023;18:e06.
13. Azizi M, Sapoval M, Gosse P, et al. Optimum and stepped care standardised antihypertensive treatment with or without renal denervation for resistant hypertension (DENERHTN):a multicentre, open-label, randomised controlled trial. Lancet. 2015;385:1957-1965.
14. Bhatt DL, Kandzari DE, O'Neill WW, et al. A Controlled Trial of Renal Denervation for Resistant Hypertension. N Engl J Med. 2014;370:1393-1401.
15. Stiermaier T, Okon T, Fengler K, et al. Endovascular ultrasound for renal sympathetic denervation in patients with therapy-resistant hypertension not responding to radiofrequency renal sympathetic denervation. EuroIntervention. 2016;12:e282-e289.
16. Azizi M, Schmieder RE, Mahfoud F, et al. Endovascular ultrasound renal denervation to treat hypertension (RADIANCE-HTN SOLO):a multicentre, international, single-blind, randomised, sham-controlled trial. Lancet. 2018;391:2335-2345.
17. Azizi M, Sanghvi K, Saxena M, et al. Ultrasound renal denervation for hypertension resistant to a triple medication pill (RADIANCE-HTN TRIO):a randomised, multicentre, single-blind, sham-controlled trial. Lancet. 2021;397:2476-2486.
18. Azizi M, Saxena M, Wang Y, et al. Endovascular Ultrasound Renal Denervation to Treat Hypertension:The RADIANCE II Randomized Clinical Trial. JAMA. 2023;329(8):651-661.
19. Lauder L, Kandzari DE, Lüscher TF, Mahfoud F. Renal denervation in the management of hypertension. EuroIntervention. 2024;20:E467-E478.
20. Reuter E. The FDA approved 2 renal denervation devices. There are still questions about who will benefit. MedTech Dive. 13 Dec 2023. Available at:https://www.medtechdive.com/news/renal-denervation-recor-medtronic-evidence/702385/. Accessed 20 Dec 2024.
21. Kario K, Yokoi Y, Okamura K, et al. Catheter-based ultrasound renal denervation in patients with resistant hypertension:the randomized, controlled REQUIRE trial. Hypertens Res. 2022;45:221-231.
22. Higgins JPT, Thomas J, Chandler J, et al. Cochrane Handbook for Systematic Reviews of Interventions version 6.4 (updated August 2023). Cochrane;2023. Avalilable at:https://training.cochrane.org/handbook. Accessed 1 Dec 2024.
23. Sterne JAC, Savovic´J, Page MJ, et al. RoB 2:a revised tool for assessing risk of bias in randomised trials. BMJ. 2019;366.
24. Wilson DB. Practical meta-analysis effect size calculator (Version 2023.11.27). 2023. Available at:https://www.campbellcollaboration.org/calculator/d-ordinal-freq. Accessed 20 Dec 2024.
25. DerSimonian R, Laird N. Meta-analysis in clinical trials. Control Clin Trials. 1986;7:177-188.
26. Azizi M, Schmieder RE, Mahfoud F, et al. Six-Month Results of Treatment-Blinded Medication Titration for Hypertension Control After Randomization to Endovascular Ultrasound Renal Denervation or a Sham Procedure in the RADIANCE-HTN SOLO Trial. Circulation. 2019;139:2542-2553.
27. Azizi M, Mahfoud F, Weber MA, et al. Effects of Renal Denervation vs Sham in Resistant Hypertension After Medication Escalation:Prespecified Analysis at 6 Months of the RADIANCE-HTN TRIO Randomized Clinical Trial. JAMA Cardiol. 2022;7:1244.
28. Mauri L, Kario K, Basile J, et al. A multinational clinical approach to assessing the effectiveness of catheter-based ultrasound renal denervation:The RADIANCE-HTN and REQUIRE clinical study designs. Am Heart J. 2018;195:115-129.
29. Sterne JAC, Sutton AJ, Ioannidis JPA, et al. Recommendations for examining and interpreting funnel plot asymmetry in meta-analyses of randomised controlled trials. BMJ. 2011;343:d4002.
30. Epstein M, De Marchena E. Is the failure of SYMPLICITY HTN-3 trial to meet its efficacy endpoint the “end of the road“for renal denervation? J Am Soc Hypertens. 2015;9:140-149.
31. Haribabu S, Sharif F, Zafar H. Recent trends in renal denervation devices for resistant hypertension treatment. Ir J Med Sci. 2021;190:971-979.
32. McCarthy CP, Natarajan P. Systolic Blood Pressure and Cardiovascular Risk:Straightening the Evidence. Hypertension. 2023;80:577-579.
33. Kario K, Kanegae H, Okawara Y, Tomitani N, Hoshide S. Home Blood Pressure Variability Risk Prediction Score for Cardiovascular Disease Using Data From the J-HOP Study. Hypertension. 2024;81:2173-2180.
34. Rader F, Kirtane AJ, Wang Y, et al. Durability of blood pressure reduction after ultrasound renal denervation:three-year follow-up of the treatment arm of the randomised RADIANCE-HTN SOLO trial. EuroIntervention. 2022;18:E677-E685.
35. Wang G, Grosse SD, Schooley MW. Conducting Research on the Economics of Hypertension to Improve Cardiovascular Health. Am J Prev Med. 2017;53(6 Suppl 2):S115.
36. Kario K, Okura A, Hoshide S, Mogi M. The WHO Global report 2023 on hypertension warning the emerging hypertension burden in globe and its treatment strategy. Hypertens Res. 2024 47:5. 2024;47:1099-1102.
37. Kumar A, He S, Pollack LM, et al. Hypertension-Associated Expenditures Among Privately Insured US Adults in 2021. Hypertension. 2024;81:2318-2328.
38. Taylor RS, Bentley A, Metcalfe K, et al. Cost Effectiveness of Endovascular Ultrasound Renal Denervation in Patients with Resistant Hypertension. Pharmacoecon Open. 2024;8:525.
39. Rodríguez-Leor O, M. Ryschon A, N. Cao K, et al. Cost-effectiveness analysis of radiofrequency renal denervation for uncontrolled hypertension in Spain. REC Interv Cardiol. 2024;6:305-312.
40. M Zeijen VJ, Völz S, Zeller T, et al. Long-term safety and efficacy of endovascular ultrasound renal denervation in resistant hypertension:8-year results from the ACHIEVE study. Clin Res Cardiol. 2024. https://doi.org/10.1007/s00392-024-02555-7.
41. Azizi M, Daemen J, Lobo MD, et al. 12-Month Results From the Unblinded Phase of the RADIANCE-HTN SOLO Trial of Ultrasound Renal Denervation. JACC Cardiovasc Interv. 2020;13:2922-2933.
42. Hamrahian SM, Maarouf OH, Fülöp T. A Critical Review of Medication Adherence in Hypertension:Barriers and Facilitators Clinicians Should Consider. Patient Prefer Adherence. 2022;16:2749.
43. Borenstein M. How to understand and report heterogeneity in a meta-analysis:The difference between I-squared and prediction intervals. Integr Med Res. 2023;12:101014.
44. Kario K, Kai H, Nanto S, Yokoi H. Anti-hypertensive medication adherence in the REQUIRE trial:post-hoc exploratory evaluation. Hypertens Res. 2023;46:2044-2047.
45. Mahfoud F, Azizi M, Ewen S, et al. Proceedings from the 3rd European Clinical Consensus Conference for clinical trials in device-based hypertension therapies. Eur Heart J. 2020;41:1588-1599.
46. Kandzari DE, Mahfoud F, Weber MA, et al. Clinical Trial Design Principles and Outcomes Definitions for Device-Based Therapies for Hypertension:A Consensus Document From the Hypertension Academic Research Consortium. Circulation. 2022;145:847-863.
47. Kandzari DE, Mahfoud F, Bhatt DL, et al. Confounding Factors in Renal Denervation Trials:Revisiting Old and Identifying New Challenges in Trial Design of Device Therapies for Hypertension. Hypertension. 2020;76:1410-1417.

aServicio de Cardiología, Hospital Clínico Universitario de Valladolid, Instituto de Ciencias del Corazón (ICICOR), Valladolid, Spain
bCentro de Investigación Biomédica en Red de Enfermedades Cardiovasculares (CIBERCV), Spain


aServicio de Cardiología, Consorcio Hospital General Universitario de Valencia, Valencia, Spain
bServicio de Cardiología, Hospital QuironSalud Valencia, Valencia, Spain

aServicio de Cardiología, Hospital del Mar, Barcelona, Spain
bCentro de Investigación Biomédica en Red de Enfermedades Cardiovasculares (CIBERCV), Spain


